The CFO-Proof Playbook: How to Monitor Rotating Equipment & Prove Its ROI in 2025
Jul 29, 2025
how to monitor rotating equipment
The low, rhythmic hum of your plant’s rotating equipment is the sound of money being made. But inside that hum is a story—a story of stress, wear, and eventual failure. For maintenance managers and reliability engineers, the question isn't if a critical pump, motor, or compressor will fail, but when, and how much it will cost when it does.
For years, the answer was a cycle of reactive repairs and calendar-based PMs. But in 2025, that's no longer enough. Your competition is getting smarter, and your CFO is demanding more than just uptime—they want a quantifiable return on every dollar spent.
This isn't just another list of monitoring techniques. This is a strategic playbook. It’s a guide to transforming your maintenance department from a cost center into a profit driver. We'll show you not only how to monitor your rotating equipment but how to build an undeniable business case for it, implement a modern tech stack, and prove its value in the language your leadership understands: dollars and cents.
Why "Monitoring" Isn't Enough Anymore
Let's be honest: a catastrophic, unexpected failure of a critical asset feels like a punch to the gut. The frantic calls, the cascading production delays, the overtime for the crew, the emergency-freight costs for parts—it's a nightmare we've all lived through. The traditional approach was to simply accept this as a cost of doing business.
But the landscape has changed. The rise of the Industrial Internet of Things (IIoT), advanced analytics, and a deeper understanding of asset failure patterns has armed us with the tools to change the narrative.
The goal is no longer to simply "monitor" equipment by collecting data. The goal is to implement a holistic asset health management strategy. This means using the right data, from the right techniques, at the right time, to make proactive, cost-effective decisions that directly impact the bottom line. It’s about moving from asking "Is it running?" to "How well is it running, and how long can it run this well before an inexpensive, planned intervention is required?"
The foundation for this entire strategic shift is a simple but powerful concept that should be every reliability professional's secret weapon: the P-F Curve.
The CFO-Proof Framework: Justifying Your Monitoring Program
Before you can even think about buying a single sensor or piece of software, you need to secure the budget. And to do that, you need to speak the language of the C-suite. They don't care about vibration in millimeters per second; they care about EBITDA, ROI, and risk mitigation. Here’s how you build your case.
Step 1: Speak Their Language - From Downtime to Dollars
"Downtime" is a maintenance term. "Lost Revenue Opportunity" is a business term. You need to translate your operational pain points into financial metrics. The first step is to calculate the True Cost of Downtime for a critical asset. Don't just estimate. Build a defensible number.
True Cost of Downtime = (Lost Revenue) + (Wasted Labor & Overtime) + (Cost of Parts & Freight) + (Ancillary Costs)
- Lost Revenue: This is the big one. If a critical pump in a production line fails, how many units per hour are you not producing? Multiply that by your profit margin per unit.
- Example: A line produces 100 units/hour with a $50 profit margin/unit. An 8-hour outage costs $40,000 in lost profit opportunity.
- Wasted Labor & Overtime: How many operators are standing idle? How many maintenance techs are on overtime for the emergency repair?
- Example: 4 operators idle at $40/hr + 2 techs on OT at $75/hr for 8 hours = $2,560.
- Cost of Parts & Freight: What's the cost of the replacement motor, bearings, or coupling? More importantly, what's the premium for expedited, overnight shipping?
- Example: A $5,000 motor + $800 in emergency freight = $5,800.
- Ancillary Costs: Did the failure cause a quality issue, leading to scrap? Was there a safety incident? Did it damage other upstream or downstream components? These are harder to quantify but are very real.
In this simple example, a single 8-hour failure cost over $48,360. Now, compare that to the cost of a monitoring program that could have prevented it. This is how you start the conversation.
Step 2: Understanding the P-F Curve (Your Secret Weapon for Budget Approval)
The P-F Curve is the most important concept in predictive maintenance. It plots the health of a component over time, from the point a Potential Failure (P) is first detectable to the point of Functional Failure (F), where it can no longer do its job.
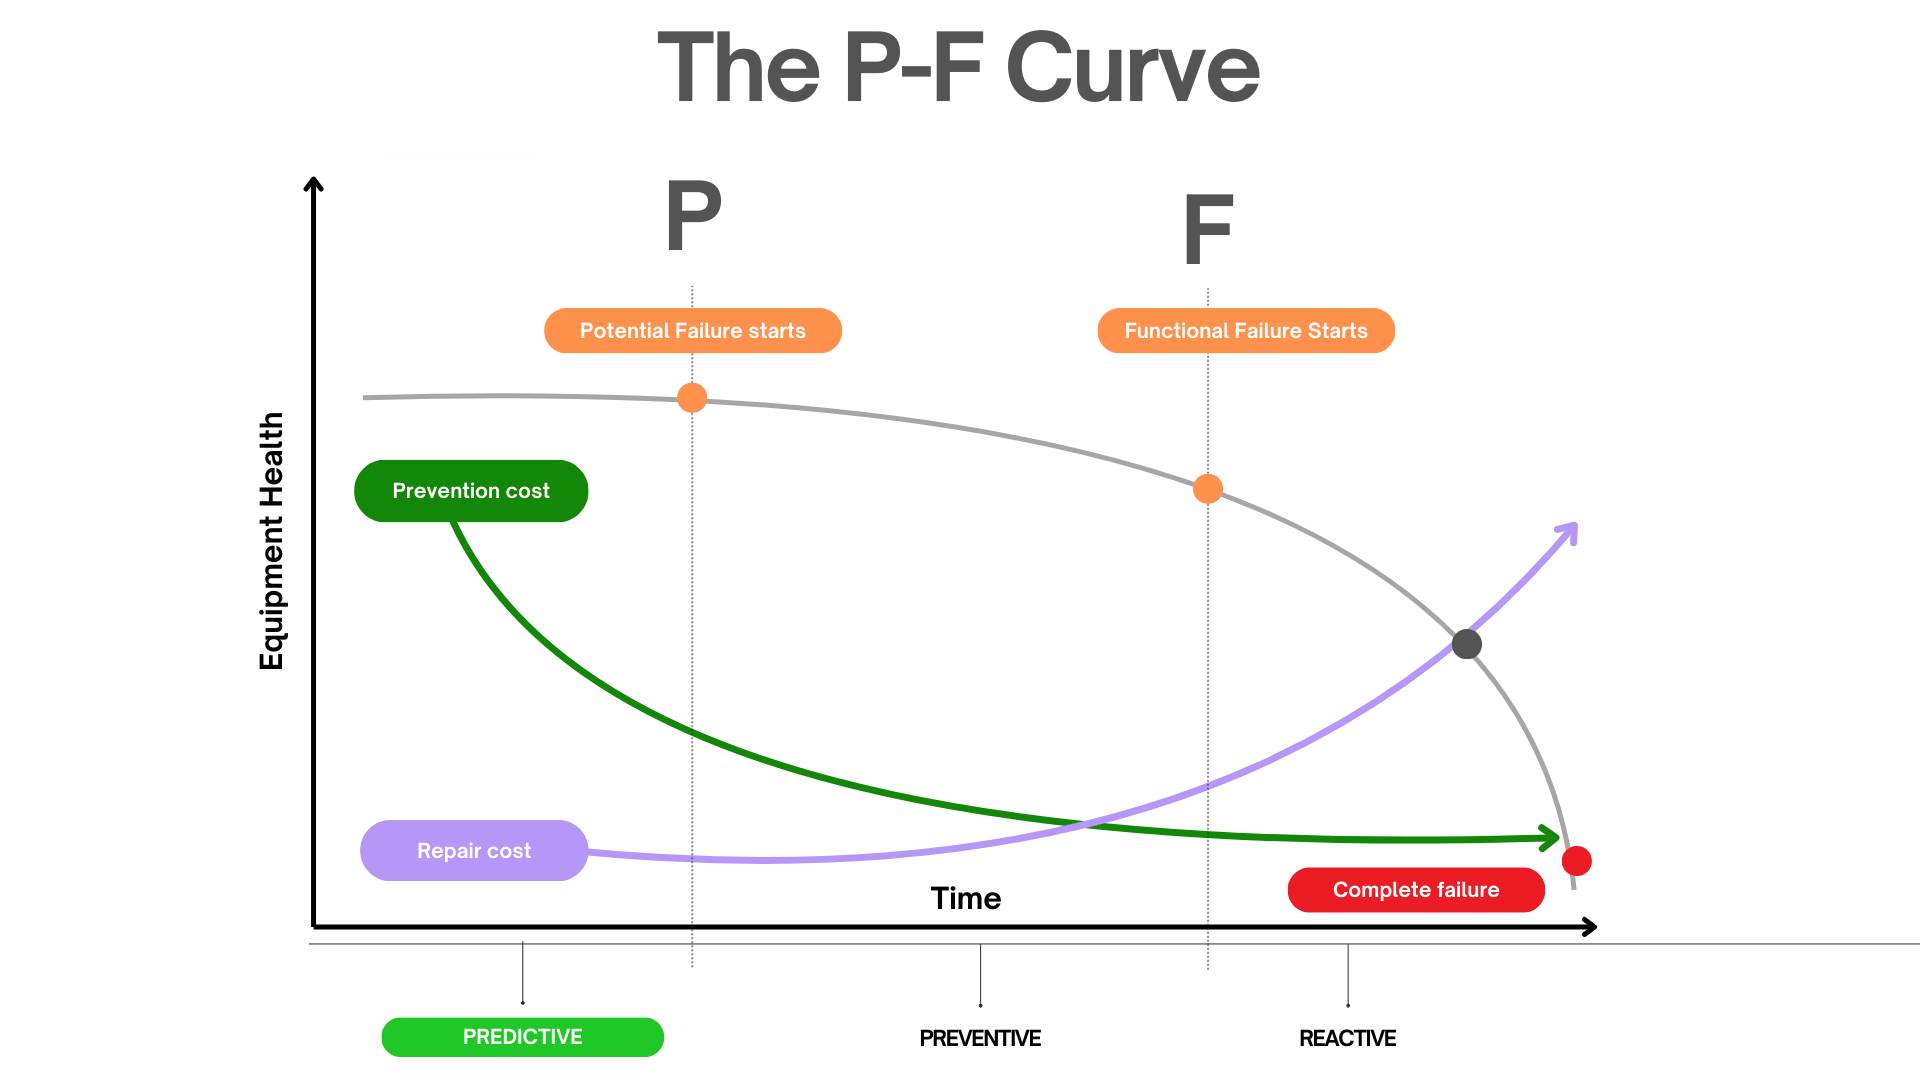
The interval between P and F is your window of opportunity. It's the time you have to plan, schedule, and execute a repair on your own terms, not the machine's. The key takeaway is that different monitoring techniques can detect a problem at different points along this curve.
- Early on the Curve (Near P): This is where subtle defects begin. Microscopic pitting in a bearing race, for example. Techniques like Oil Analysis and Ultrasonics excel here. The cost of repair is minimal—perhaps a lubrication change or a planned bearing replacement during the next scheduled outage.
- Mid-Curve: The defect is now growing. The microscopic pits have become spalls. This generates abnormal friction and heat. Vibration Analysis and Infrared Thermography will now clearly detect the issue. The repair is still manageable and can be planned.
- Late on the Curve (Near F): The asset is now audibly noisy, excessively hot, or visibly vibrating. This is the point of "imminent failure." It's detectable by human senses. By the time you reach this stage, your window for a low-cost, planned repair is gone. You are now in reactive mode.
Presenting the P-F Curve to leadership visually demonstrates the value proposition: The earlier we invest in detection (moving left on the curve), the longer our planning window and the lower our repair cost.
Step 3: From Reactive to Predictive - Mapping the Maintenance Maturity Model
Finally, frame your proposed program as a journey of improvement. Most organizations fall into one of these stages of maintenance maturity:
- Reactive (Run-to-Failure): The "if it ain't broke, don't fix it" model. This is the most expensive and disruptive strategy.
- Preventive (Time-Based): Performing maintenance at fixed intervals (e.g., greasing a motor every 3 months) regardless of its actual condition. This is better than reactive, but often leads to over-maintenance (wasting resources on healthy equipment) or under-maintenance (failing before the scheduled PM).
- Condition-Based (CBM): The first step into proactive maintenance. You use monitoring techniques to assess the actual condition of an asset to decide when maintenance is needed. "The bearing is showing early signs of wear; let's schedule a replacement for next month's planned downtime."
- Predictive (PdM): This uses CBM data, trends, and algorithms to forecast when a failure is likely to occur. It answers the question, "Based on the current vibration trend, this motor's bearings have an estimated useful life of 45 days." This allows for optimal planning and parts procurement.
- Prescriptive: The pinnacle of maintenance maturity. This advanced stage, often powered by AI, not only predicts a failure but also recommends the optimal course of action to mitigate it, considering factors like production schedules, inventory, and labor resources. The ultimate goal is to leverage a system that provides not just data, but clear, actionable guidance, which is the core of prescriptive maintenance.
By identifying where your organization currently sits, you can present your monitoring program as a concrete plan to move up the ladder, with each step delivering a greater ROI.
The Core Four: Essential Condition Monitoring Techniques for Rotating Equipment
Once you have your strategic framework, it's time to select your tools. There is no single "best" technique; the optimal approach is a blended one, using the right tool for the right failure mode. Here are the four pillars of a robust rotating equipment monitoring program.
H3: Vibration Analysis: The Heartbeat of Your Machinery
Vibration analysis is the cornerstone of monitoring rotating equipment. Every rotating machine has a unique vibration signature when it's healthy. Deviations from this baseline are often the first sign of developing mechanical problems.
- What It Is: Using sensors (accelerometers) to measure the vibration of a machine and analyzing that data in both the time and frequency domains. A Fast Fourier Transform (FFT) is used to break down the complex vibration signal into its individual frequencies, which can be tied directly to specific machine components and fault types.
- What It Detects:
- Imbalance: A "heavy spot" in a rotating component, causing a strong vibration at 1x the running speed.
- Misalignment: When two coupled shafts are not in line, causing vibration at 1x, 2x, and sometimes higher multiples of the running speed.
- Mechanical Looseness: Can cause a "flat top" appearance in the time waveform and multiple harmonics in the spectrum.
- Bearing Defects: Generate distinct, high-frequency tones corresponding to the ball pass frequencies of the inner race, outer race, cage, or rolling elements.
- Gear Wear: Creates frequencies related to the gear mesh frequency (GMF) and its sidebands.
- P-F Curve Position: Mid-curve. It can detect most mechanical faults weeks or months before they become catastrophic, providing ample time for planning.
- Tools & Application: Ranges from handheld data collectors for route-based monitoring to permanently mounted wireless or wired sensors for continuous online monitoring of the most critical assets. This is the go-to technique for a wide range of equipment, making it a foundational element of any program for the predictive maintenance of motors, pumps, fans, and gearboxes.
H3: Infrared Thermography: Seeing Problems Before They Escalate
Heat is a byproduct of energy loss, often in the form of friction or electrical resistance. Infrared (IR) thermography allows you to "see" this heat, making it a powerful, non-contact inspection tool.
- What It Is: Using a thermal imaging camera to capture the infrared radiation emitted by an object and convert it into a visual image (thermogram) where different colors represent different surface temperatures.
- What It Detects:
- Overheating Bearings: A clear sign of poor lubrication or advanced wear.
- Coupling Issues: Misalignment can cause couplings to run hot.
- Electrical Faults: Loose connections, overloaded circuits, and phase imbalances in motor control centers (MCCs) show up clearly as hot spots. This is a critical safety application.
- Process Issues: Blockages in pipes, tank levels, and faulty steam traps can all be identified with thermography.
- P-F Curve Position: Mid-to-late curve. While some issues like electrical faults can be caught very early, mechanical heat signatures often appear after a defect has already started to cause significant friction. It's an excellent corroborating technology for vibration analysis.
- Best Practices: For accurate readings, it's critical to understand and adjust for emissivity (a material's ability to emit thermal energy) and reflected temperature. Establishing thermal baselines of healthy equipment under normal operating loads is essential for identifying anomalies. For more on best practices, professional organizations like ASME provide valuable resources and standards for thermographers.
H3: Oil Analysis & Lubrication Management: The Blood Test for Your Assets
If vibration is the heartbeat, then lubricant is the lifeblood of your machinery. Analyzing the oil is like performing a blood test on a person—it can reveal a wealth of information about the health of both the lubricant and the machine itself.
- What It Is: Taking a representative sample of in-service lubricant and sending it to a lab for a battery of tests. This is more than just a technique; it's a core part of lubrication management.
- What It Detects:
- Component Wear: Elemental analysis (spectrometry) detects microscopic metal particles, identifying which components are wearing. High levels of iron might point to gear or bearing wear, while copper could indicate bushing wear.
- Contamination: Particle counters (measured by ISO 4406 cleanliness codes) detect dirt, a major cause of abrasive wear. Chemical tests detect contaminants like water, coolant, or the wrong type of oil.
- Oil Degradation: Tests for viscosity, oxidation, and additive depletion tell you if the oil itself is still fit for service or needs to be changed.
- P-F Curve Position: Very early. Oil analysis can detect microscopic wear particles long before the damage is severe enough to generate significant vibration or heat. It offers the earliest warning for many wear-related failure modes.
- Crucial Point: A world-class oil analysis program is useless if your lubrication practices are poor. Proper storage and handling to prevent contamination, using the correct lubricant, applying the right amount at the right interval, and using proper sampling procedures are non-negotiable. Authoritative bodies like the International Council for Machinery Lubrication (ICML) offer certifications and best-practice guides that are invaluable for developing a robust program.
H3: Ultrasonic Testing: Hearing the Unhearable
Our ears are limited to a frequency range of about 20 Hz to 20 kHz. Many early-stage mechanical and electrical faults generate high-frequency sounds well above this range. Airborne and structure-borne ultrasonic testing equipment detects these sounds and translates them into an audible range, allowing technicians to "hear" problems long before they are otherwise detectable.
- What It Is: Using a specialized acoustic sensor to detect high-frequency sound waves (typically 20 kHz to 100 kHz). The tool uses a process called heterodyning to convert these inaudible frequencies into an audible signal that can be heard through headphones and analyzed visually.
- What It Detects:
- Early-Stage Bearing Failure: The very first sign of bearing trouble is often a lack of lubrication, which causes microscopic friction and high-frequency ringing. Ultrasound can detect this "starvation" stage before any measurable wear has occurred.
- Compressed Air & Gas Leaks: Leaks create turbulent flow, which generates a broad spectrum of sound, including a strong ultrasonic signal that can be pinpointed even in noisy environments.
- Electrical Faults: Dangerous conditions like arcing, tracking, and corona in high-voltage equipment emit ultrasound.
- P-F Curve Position: Extremely early. For bearing faults, ultrasound provides the earliest possible warning, often preceding even oil analysis. It allows for a simple, corrective action (greasing the bearing) to prevent a failure from ever progressing down the P-F curve.
Building Your Modern Monitoring Tech Stack in 2025
Knowing the techniques is one thing; implementing them with modern technology is another. Your 2025 tech stack should be scalable, integrated, and intelligent.
Choosing Your Weapons: Sensors and Data Acquisition
The days of being limited to expensive, cumbersome data collectors are over. You now have a spectrum of options to fit any asset and budget.
- Wired vs. Wireless:
- Wired (Online) Systems: The gold standard for the most critical, high-speed, or inaccessible machines. They provide continuous, real-time data but come with high installation costs and complexity.
- Wireless Sensors: The game-changer of the last decade. These battery-powered sensors can be installed in minutes, dramatically lowering the cost of monitoring. They are perfect for expanding your program to "balance of plant" assets that were previously unmonitored. While they don't typically provide the same real-time stream as wired systems, they can take and transmit readings multiple times per day, which is more than sufficient for most failure modes.
- The Rise of IIoT and AI-Powered Sensors: The latest generation of sensors is more than just a data collector. Many now have onboard processing and AI-powered predictive maintenance capabilities. They can learn an asset's normal operating signature and send an alert only when a true anomaly is detected, filtering out the noise and reducing the burden on your analysts.
The Brains of the Operation: Software and Analytics
Data is useless without a system to manage, analyze, and act on it. This is where your central maintenance platform becomes the hub of your entire strategy.
A modern Computerized Maintenance Management System (CMMS) is the critical link between detection and action. An alert from a wireless vibration sensor shouldn't just send an email; it should be integrated to automatically trigger a series of events. For instance, an advanced CMMS software can:
- Receive an alarm from a sensor indicating a "Stage 2" bearing fault.
- Automatically generate a work order with a pre-defined priority level.
- Assign the work order to the appropriate technician.
- Attach the relevant PM procedure, safety checklist, and a link to the vibration data.
- Check the inventory for the required bearing and gasket, and if not available, create a purchase request.
This level of integration transforms your monitoring program from a passive data-gathering exercise into an active, automated workflow that drives efficiency and ensures that insights are never lost. Effective work order software is the engine that powers this entire process.
A Phased Implementation Plan: From Pilot Project to Plant-Wide Rollout
Trying to boil the ocean is a recipe for failure. A successful, sustainable program is built incrementally.
- Step 1: Launch a Pilot Program. Don't try to monitor everything at once. Select 5-10 assets for your pilot. Choose a mix: a few highly critical assets and a few "bad actors" that fail frequently. This gives you the best chance to demonstrate a quick win.
- Step 2: Define Success Metrics. Before you begin, define what a "win" looks like. Is it preventing one specific type of failure? Is it reducing PM labor on those assets by 20%? Is it extending the life of a gearbox by 6 months? Make it specific and measurable.
- Step 3: Collect Data & Demonstrate ROI. Run the pilot for 3-6 months. Track your successes meticulously. When you catch a developing fault and perform a planned, low-cost repair, document it. Use the "True Cost of Downtime" calculation you made earlier to show exactly how much money you saved. This is your ammunition for the next budget meeting.
- Step 4: Scale & Standardize. With a successful pilot and proven ROI, you can now make the case for expansion. Use the lessons learned from the pilot to create standardized procedures for data collection, analysis, and follow-up actions. Train your team and begin a phased rollout across other critical areas of the plant. A great resource for structuring such programs can be found on industry portals like Reliabilityweb, which offer a wealth of knowledge on implementation frameworks.
Common Pitfalls and How to Avoid Them
Even the best-laid plans can go awry. Here are some of the most common traps that can derail a condition monitoring program and how to sidestep them.
Pitfall #1: Data Overload, Insight Famine
It's easy to get buried in data. With wireless sensors sending readings every hour, you can quickly accumulate millions of data points. The danger is collecting data for data's sake, without a clear plan for how to turn it into actionable insights.
- Solution: Start with the end in mind. Before deploying a sensor, ask: "What specific failure modes am I looking for on this asset, and what do their signatures look like?" Set intelligent, statistically-derived alarm thresholds (e.g., based on standard deviation from the baseline) rather than simple, fixed numbers. Leverage software that uses AI to automatically screen data and only flag significant anomalies for human review.
Pitfall #2: The "Set It and Forget It" Mentality
A common mistake is to install a suite of expensive sensors and assume the technology will do all the work. Technology is an enabler, not a replacement for human expertise.
- Solution: Condition monitoring is an active, continuous process. It requires a program owner and a team that is responsible for reviewing data, validating alarms, performing root cause analysis, and ensuring corrective actions are taken. The system itself needs maintenance—sensors need calibration, batteries need changing, and software needs updating.
Pitfall #3: Lack of Team Buy-In and Training
If your maintenance technicians on the floor see new technology as a threat, a hassle, or "management's new toy," your program is doomed. They are your eyes and ears on the plant floor, and their buy-in is essential.
- Solution: Involve the team from day one. Explain the why behind the program—how it will make their jobs safer, reduce frustrating emergency calls, and allow them to focus on higher-value proactive work. Provide comprehensive training not just on how to use the tools, but on how to interpret the data. Celebrate their successes when they make a good "catch."
Pitfall #4: Ignoring the Fundamentals
You can have the most advanced AI-powered predictive analytics platform in the world, but if your assets are not properly aligned, balanced, and lubricated, you're just getting a high-tech, expensive report telling you that you're failing at the basics.
- Solution: Technology complements, but does not replace, precision maintenance fundamentals. A successful monitoring program runs in parallel with a robust program for basic care. Use your monitoring data to reinforce the importance of these fundamentals. For example, show how vibration levels decrease dramatically after a precision alignment is performed.
Conclusion: From Monitoring to Mastering Your Rotating Assets
The question is no longer if you should be monitoring your rotating equipment, but how you can do it strategically to deliver maximum value. In 2025, a world-class program is not defined by the number of sensors you have, but by the quality of the decisions you make.
It begins by building a CFO-proof business case, translating maintenance needs into the language of finance. It’s powered by a blended strategy of core techniques—vibration, thermography, oil analysis, and ultrasonics—each chosen to detect specific failure modes at the optimal point on the P-F curve. And it’s all brought together by an integrated technology stack, where smart sensors and intelligent software automate workflows and turn data into decisive action.
This is a journey up the maturity curve, away from the chaos of reactive repairs and toward the controlled, profitable state of predictive and prescriptive operations. Start small with a pilot program, prove the value, and build your momentum. By shifting your mindset from simply monitoring equipment to strategically managing asset health, you will not only prevent failures but also solidify your department's role as an indispensable driver of your company's success.
Ready to take the next step in your maintenance journey? Explore how a comprehensive equipment maintenance software platform can become the central hub for your entire asset health strategy.
