The 2025 Playbook: How to Choose Vibration Sensors for Actionable Insights, Not Just Data
Jul 21, 2025
how to choose vibration sensors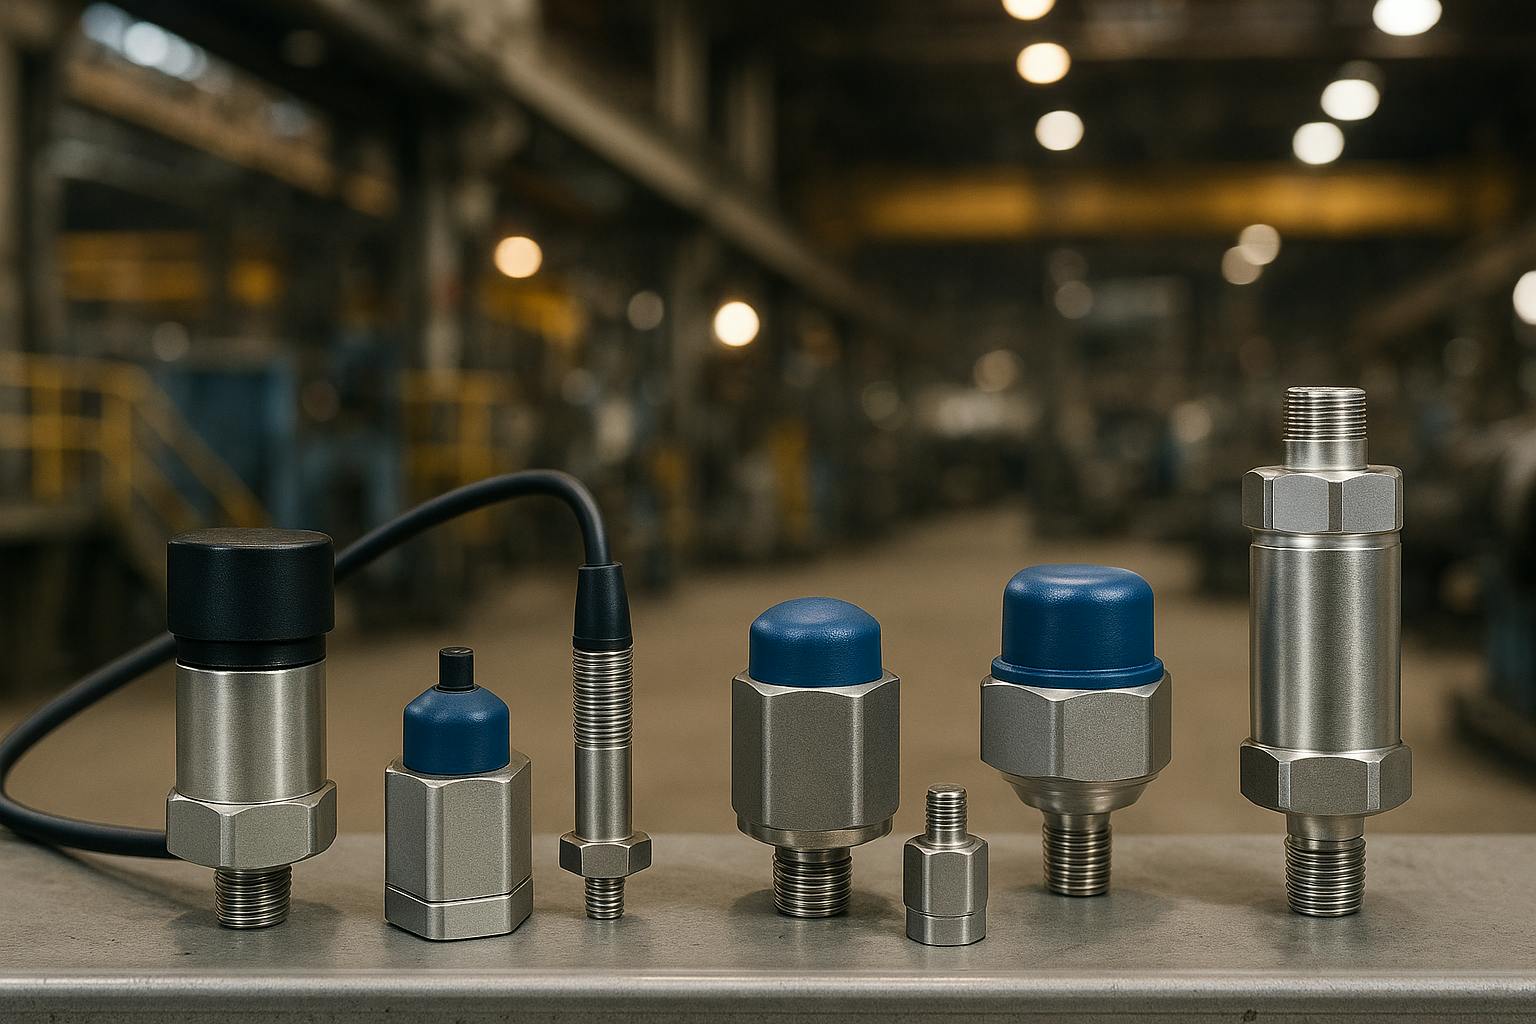
Unplanned downtime. It’s the specter that haunts every maintenance manager and facility operator. In 2025, the cost of a single hour of downtime in a manufacturing facility can easily spiral into tens or even hundreds of thousands of dollars. The traditional approach of reactive or even preventive maintenance is no longer enough to stay competitive. The goal has shifted from fixing what's broken to predicting and preventing failure before it ever happens. At the heart of this modern industrial revolution lies a small but powerful device: the vibration sensor.
But here’s a truth that experienced professionals know all too well: simply slapping a sensor on a motor is not a strategy. Choosing the right vibration sensor is one of the most critical decisions you'll make when building a world-class condition-based monitoring (CBM) or predictive maintenance (PdM) program. It's not a simple hardware purchase; it's the foundational investment in the quality, accuracy, and ultimate success of your entire maintenance ecosystem.
This guide is not another generic list of sensor types. This is your "Data-to-Actionable-Work-Order" playbook. We'll frame the selection process not around the sensor itself, but around the end goal: generating a precise, automated, and effective work order that prevents catastrophic failure, minimizes disruption, and maximizes production.
Why Your Vibration Sensor Choice is the Foundation of Your Entire PdM Program
In the world of data science, there's a timeless principle: Garbage In, Garbage Out (GIGO). This concept is brutally relevant to predictive maintenance. Your sophisticated AI algorithms, your advanced analytics platform, and your meticulously planned maintenance schedules are all completely dependent on the quality of the data they receive. The vibration sensor is the single point of origin for that data.
Think of it like a doctor's stethoscope. A cheap, low-quality stethoscope might tell the doctor that a heart is beating, but it won't reveal the subtle murmur that signals a developing valve problem. A high-fidelity, professional stethoscope allows the doctor to hear every detail, leading to an early diagnosis and preventative treatment.
Your vibration sensor is your machine's stethoscope.
- A poor sensor choice will feed your system noisy, inaccurate, or incomplete data. This leads to missed detections, false alarms (which erode trust in the system), and an inability to diagnose the root cause of a problem.
- A strategic sensor choice provides clean, high-fidelity data that captures the earliest signs of wear and tear. This is the raw material that a powerful AI-powered predictive maintenance platform needs to work its magic. It allows the system to not only detect an anomaly but to classify the specific failure mode, predict its progression, and recommend a precise course of action.
The "Data-to-Actionable-Work-Order" pipeline looks like this:
- Sense: The right sensor captures a high-fidelity vibration signature from the asset.
- Analyze: The data is transmitted to a platform that uses AI to analyze trends, spectrums, and waveforms to detect and diagnose a specific developing fault.
- Act: The platform automatically triggers a detailed work order in your CMMS, complete with the diagnosis, recommended actions, and required parts list.
If the first step is flawed, the entire chain breaks down. That's why we start here.
Step 1: Define Your Goal - What Failure Modes Are You Hunting?
Before you look at a single spec sheet, you must answer the most important question: What problem are you trying to solve? You cannot choose the right tool until you know the job. In vibration analysis, this means identifying the specific machine failure modes you need to detect.
Different mechanical faults generate vibrations at different frequencies. Choosing a sensor is fundamentally about matching the sensor's capabilities to the frequencies of the faults you want to find.
Common Rotating Machinery Failure Modes
Here are some of the most common culprits of equipment failure and the frequency ranges where their symptoms typically appear:
- Imbalance: Occurs when the center of mass of a rotating component is not aligned with its center of rotation. Think of a car tire with a missing weight. This is a common issue in fans, blowers, and motors.
- Vibration Signature: A strong peak at 1x the machine's running speed. This is a low-frequency event.
- Misalignment: Occurs when the centerlines of two coupled shafts are not aligned. This puts immense stress on bearings, seals, and couplings.
- Vibration Signature: Typically shows a strong peak at 2x the running speed, but can also show peaks at 1x and 3x. This is a low-to-mid-frequency event.
- Mechanical Looseness: Can be either structural (loose mounting bolts) or internal (worn components).
- Vibration Signature: Often characterized by multiple harmonics (1x, 2x, 3x, 4x, etc.) of the running speed. This spans the low-to-mid-frequency range.
- Bearing Faults: These are the golden ticket for predictive maintenance. The microscopic cracks and spalls in a bearing's races or rolling elements generate distinct, repetitive, high-frequency impacts.
- Vibration Signature: These faults generate very specific tones at high frequencies, often well above 10x the running speed. Detecting these early is key to preventing catastrophic failure.
- Gear Mesh Issues: Worn, chipped, or broken gear teeth create impact events every time the damaged teeth mesh.
- Vibration Signature: A primary peak at the Gear Mesh Frequency (GMF = number of teeth x RPM), often with sidebands around it indicating the severity. This is a high-frequency event.
Matching Failure Modes to Frequency Ranges and the P-F Curve
The relationship between these failure modes and their detection is best explained by the P-F Curve. This is a foundational concept in reliability engineering, detailed extensively by sources like Reliabilityweb.
The curve shows that as a failure develops (from point P, Potential Failure, to point F, Functional Failure), it becomes easier to detect but leaves you with less time to act.
- High-Frequency Events (e.g., Bearing Faults): These are the earliest indicators of failure. They appear at the very beginning of the P-F curve, giving you weeks or even months to plan and schedule repairs.
- Mid-Frequency Events (e.g., Misalignment, Looseness): These appear later on the curve.
- Low-Frequency Events (e.g., Imbalance): These are often present but can worsen closer to failure.
- Audible Noise & Heat: By the time you can hear or feel a problem, you are dangerously close to point F, and catastrophic failure is imminent.
Your Goal: Choose a sensor with a frequency response wide enough to detect the high-frequency events that give you the longest possible P-F interval, maximizing your planning horizon.
Step 2: Decoding the Specs - The Big Three Sensor Types
Now that you know what you're looking for (the failure modes and their frequencies), you can start evaluating the tools. In the world of industrial vibration monitoring, there are three primary types of sensors you'll encounter.
The Workhorse: Piezoelectric (PE) Accelerometers
For decades, the piezoelectric accelerometer has been the gold standard for industrial vibration analysis, and for good reason.
- How They Work: PE accelerometers use a piezoelectric crystal (like quartz or a ceramic material). When the sensor is subjected to vibration (acceleration), the crystal is stressed, causing it to generate a tiny electrical charge that is directly proportional to the acceleration. An internal circuit converts this charge into a voltage signal that can be measured.
- Pros:
- Extremely Wide Frequency Range: They can accurately measure everything from very low-speed imbalance to the ultra-high frequencies of early bearing and gear faults.
- High Sensitivity & Dynamic Range: They can pick up very subtle vibrations while also handling very strong ones without distortion.
- Incredibly Robust: Designed for harsh industrial environments, they are hermetically sealed and can withstand extreme temperatures and chemical exposure.
- Cons:
- Cost: Traditionally the most expensive option per sensor.
- Cabling: Requires high-quality, low-noise cabling, and the installation of that cable and conduit can often cost more than the sensor itself.
- When to Use Them: PE accelerometers are the undisputed choice for your most critical assets: large motors, high-speed compressors, critical pumps, and any machine where the cost of failure is astronomical. They provide the highest fidelity data for the most demanding applications.
The Challenger: MEMS Accelerometers
MEMS (Micro-Electro-Mechanical Systems) technology has matured rapidly and is now a powerful and cost-effective option for a huge range of applications.
- How They Work: A MEMS accelerometer is a microchip with a microscopic moving mass (a proof mass) suspended by tiny springs. As the sensor vibrates, this mass moves. The sensor measures the change in capacitance (electrical charge) between the moving mass and a set of fixed plates. This change is proportional to the acceleration.
- Pros:
- Lower Cost: Significantly less expensive to manufacture, which makes them ideal for widespread deployment.
- Small Size & Low Power: Their tiny footprint and low power consumption make them perfect for integration into battery-powered industrial wireless vibration sensors.
- Excellent Low-Frequency Response: They are inherently good at measuring very slow movements and can measure down to 0 Hz (DC), which is useful for detecting tilt or sustained acceleration.
- Cons:
- Frequency Range Limitations: While rapidly improving, many MEMS sensors have a lower upper-frequency limit compared to PE sensors, which can be a limitation for detecting the very earliest stages of some bearing faults.
- Higher Noise Floor: They can have more inherent electronic noise, which can sometimes mask very low-amplitude vibration signals.
- When to Use Them: MEMS sensors are the engine of the IIoT (Industrial Internet of Things). They are perfect for achieving monitoring coverage across your "balance of plant" assets—the hundreds of smaller pumps, motors, fans, and conveyors that are important but don't warrant the cost of a wired PE system. They are the key to building a scalable and affordable predictive maintenance program.
The Specialist: Proximity Probes (Eddy Current)
Proximity probes are a non-contact sensor used for a very specific but critical set of applications.
- How They Work: A proximity probe, also known as an eddy current probe, emits a high-frequency radio signal from its tip. This signal creates a magnetic field that induces small currents (eddy currents) on the surface of a conductive target, like a machine shaft. The probe measures changes in this magnetic field, which correspond directly to the gap (distance) between the probe tip and the shaft. It measures displacement, not acceleration.
- Pros:
- Direct Shaft Measurement: It measures the actual motion of the shaft relative to the bearing, which is crucial for machines with fluid-film or journal bearings where the shaft can move significantly within the bearing clearance.
- Non-Contact: It doesn't touch the rotating shaft.
- Cons:
- Complex & Expensive Installation: Requires drilling and tapping the bearing housing to mount the probe, a delicate process that requires a machine outage.
- Measures Relative Motion Only: It doesn't measure the vibration of the machine casing, so it won't detect issues like structural looseness.
- When to Use Them: Proximity probes are the domain of high-speed, critical turbomachinery. Think steam turbines, gas compressors, and large generators that run on sleeve bearings. For these assets, they are essential and often mandated by industry standards like those from the American Petroleum Institute (API).
Accelerometer vs. Vibration Sensor: Clearing the Confusion
You'll often hear these terms used interchangeably, which can be confusing. Here's the simple breakdown:
- Vibration Sensor: The generic term for any device that measures vibration. This includes accelerometers, velocity sensors, and proximity probes.
- Accelerometer: A specific type of vibration sensor that measures acceleration.
- Piezoelectric and MEMS sensors are both types of accelerometers. Because accelerometers are, by far, the most common type of sensor used for condition monitoring, the terms have become almost synonymous in practice.
Step 3: Mastering the Technical Specifications (The Nitty-Gritty)
Once you've identified your target failure modes and chosen the right sensor type for your asset, it's time to dive into the spec sheet. These numbers are what separate a sensor that works from the perfect sensor for your application.
Frequency Response (Hz/CPM): The Most Critical Spec
This is, without a doubt, the most important specification. It defines the range of frequencies the sensor can accurately measure. It's usually given as a range (e.g., 0.5 Hz to 15,000 Hz) with a tolerance (e.g., ±3 dB).
- Why it Matters: If the failure mode you're hunting occurs at a frequency outside the sensor's response range, you will never see it. It's like trying to watch a high-definition channel on an old black-and-white TV.
- How to Choose:
- Identify the highest frequency you need to detect. For gearboxes, this is the Gear Mesh Frequency (GMF). For bearings, you need to calculate the specific fault frequencies (BPFO, BPFI, BSF, FTF).
- Rule of Thumb: Select a sensor with a maximum frequency response that is at least 3 to 4 times the highest frequency of interest. This ensures you capture not just the primary frequency but also its harmonics, which are crucial for accurate diagnosis.
- Example: You have a motor running at 1780 RPM (Revolutions Per Minute).
- Running Speed = 1780 RPM / 60 = ~30 Hz (or 1780 CPM - Cycles Per Minute).
- You want to detect an outer race bearing fault, which you calculate to be around 160 Hz.
- To be safe and capture harmonics, you need a sensor with a top-end frequency response of at least 160 Hz * 4 = 640 Hz. A standard 1,000 Hz or 5,000 Hz sensor would be an excellent choice.
Sensitivity (mV/g): How "Loud" is the Signal?
Sensitivity describes how much voltage the sensor outputs for a given amount of vibration. It's typically measured in millivolts per g (mV/g), where 1 g is the acceleration due to Earth's gravity.
- Why it Matters: Sensitivity determines the sensor's signal-to-noise ratio. You need a signal strong enough to be clearly distinguished from the background electrical noise.
- How to Choose:
- 100 mV/g: This is the industry standard and the workhorse for most general-purpose machinery (motors, pumps, fans) running at moderate speeds (above 600 RPM). It offers a great balance of signal strength and measurement range.
- 500 mV/g (High Sensitivity): Best for low-speed applications (e.g., slow-turning agitators, cooling towers, paper machine rollers). On these machines, vibration levels are very low. A high-sensitivity sensor acts like a microphone with the gain turned up, amplifying the faint signals so they can be analyzed.
- 10 mV/g (Low Sensitivity): Best for very high-vibration applications, like reciprocating compressors or rock crushers. A standard 100 mV/g sensor could be overwhelmed by the intense vibration, leading to a "clipped" signal and useless data. A low-sensitivity sensor "turns down the gain," allowing it to measure high g-levels accurately.
Measurement Range (g): Don't Clip the Signal
This spec tells you the maximum acceleration the sensor can measure before its output becomes distorted or "clipped." It's directly related to sensitivity.
- Why it Matters: If the vibration of your machine exceeds the sensor's measurement range, the top of the signal waveform will be flattened. This corrupts the data, making an accurate diagnosis impossible.
- How to Choose: A 100 mV/g sensor typically has a range of ±50 g, which is more than sufficient for 95% of industrial rotating machinery. For those high-vibration applications where you'd choose a 10 mV/g sensor, you'll get a much higher range (e.g., ±500 g).
Other Key Considerations
- Temperature Range: Ensure the sensor can operate reliably at the surface temperature of your asset. Bearings can get hot!
- Sealing (IP Rating): In wet, dusty, or washdown environments, look for a sensor with an IP67 or IP68 rating, indicating it's protected from dust ingress and can be submerged in water.
- Hazardous Area Certifications: If you're monitoring equipment in an environment with flammable gases or dust (e.g., oil & gas, chemical processing), you must use sensors with the appropriate certifications, such as ATEX or IECEx.
Step 4: The Connectivity Question - Wired vs. Industrial Wireless Sensors
In 2025, this is one of the biggest decision points. How you get the data from the sensor to your analysis platform has massive implications for cost, scalability, and data resolution.
The Case for Wired Sensors
Wired systems involve running a physical cable from each sensor back to a data acquisition (DAQ) unit.
- Pros:
- Continuous, Real-Time Data: They provide a constant stream of data, which is essential for machine protection systems that need to shut down equipment in milliseconds.
- Powered by DAQ: No batteries to worry about.
- Highest Data Fidelity: The shielded cable provides the cleanest possible signal path.
- Cons:
- Prohibitive Installation Cost: The cost of engineering, purchasing, and installing conduit and cable often exceeds the cost of the hardware by 5-10x.
- Inflexible: It's difficult and expensive to add or move monitoring points.
- Best For: Your top 1-2% of "ultra-critical" assets, where any data loss is unacceptable, and which are often protected by a dedicated machine protection system (e.g., a turbine generator).
The Rise of Industrial Wireless Vibration Sensors
Wireless sensors have fundamentally changed the CBM landscape, making it accessible to everyone. These sensors collect data, often perform some initial processing onboard, and then transmit it wirelessly to a gateway.
- Pros:
- Drastically Lower Installation Cost: Installation takes minutes, not days. You can install a wireless sensor with a simple adhesive or magnetic mount, press a button, and start collecting data.
- Scalability: You can easily deploy sensors on hundreds or thousands of assets, achieving plant-wide monitoring coverage that was previously unthinkable. This allows you to monitor assets like conveyors, smaller pumps, and fans effectively.
- Flexibility: Easily move sensors to different machines as your monitoring needs change.
- Cons:
- Periodic Sampling: To conserve power, wireless sensors "wake up" at scheduled intervals (e.g., once an hour) to take a measurement. They do not provide a continuous data stream. For 98% of predictive maintenance applications, this is perfectly acceptable.
- Battery Life: They are battery-powered, and batteries will eventually need to be replaced (though many have a life of 3-7 years).
- Best For: The vast majority of plant assets (the "balance of plant"). Wireless is the key to building a cost-effective, scalable, and modern predictive maintenance program.
Step 5: Installation Best Practices - From Sensor to Software
You can choose the perfect sensor, but if it's installed incorrectly, your investment is wasted. Proper installation ensures that the vibration from the machine is transmitted faithfully to the sensor.
How to Install Vibration Sensors on Motors (and Other Assets)
-
Mounting Method: The mounting method directly affects the high-frequency response.
- Stud Mount (Best): Drilling and tapping a hole in the machine housing and directly stud-mounting the sensor provides the most rigid connection and the best possible high-frequency data transmission. This is the preferred method for permanent installations on critical assets.
- Adhesive Mount (Good): Using a strong, two-part industrial epoxy to glue a mounting pad to the machine is a very reliable alternative to drilling. It provides excellent frequency response, often nearly as good as a stud mount.
- Magnetic Mount (Acceptable): A two-pole magnet is convenient for route-based data collection or temporary diagnostics. However, it significantly reduces the high-frequency response and can be easily knocked out of place. It is not recommended for permanent PdM installations.
-
Location, Location, Location:
- Place the sensor as close to the bearing as possible. This is where the faults originate.
- Mount on a solid, flat, and clean surface. Avoid mounting on thin cooling fins or curved surfaces.
- For a standard motor, you want one sensor on the drive-end (DE) bearing and one on the non-drive-end (NDE) bearing.
-
Orientation: Vibration occurs in three dimensions. A single-axis sensor only measures in one direction. A triaxial sensor (which is essentially three sensors in one housing) is highly recommended. It captures vibration data simultaneously in the Horizontal, Vertical, and Axial directions, providing a complete picture of the machine's health. For example, misalignment often shows up best in the axial direction, while imbalance is clearest in the horizontal direction. Capturing all three is crucial for accurate diagnosis, especially for complex assets like motors.
Connecting to Your Ecosystem
The data's journey doesn't end at the sensor. It must flow seamlessly into your maintenance ecosystem. A modern system architecture looks like this:
Sensor -> Gateway -> Cloud Analytics Platform -> CMMS
The integration between your predictive analytics platform and your CMMS software is what closes the loop. It's the critical link that automates the final, most important step of our playbook.
The Final Play: Turning Data into an Actionable Work Order
This is where all the previous steps pay off. This is the "why" behind choosing the right sensor.
- Detection: Your carefully selected and properly installed triaxial wireless sensor, sampling every hour, detects a sustained increase in high-frequency vibration energy on a critical pump motor.
- Diagnosis: The data is sent to your AI platform. The algorithm analyzes the full spectrum and identifies the tell-tale signature of an outer race fault on the motor's drive-end bearing. It calculates the fault's severity and predicts a remaining useful life of 6 weeks.
- Action: Instead of just sending a vague alert, the platform, through its integration, automatically generates a new task in your work order software.
This isn't just an alert; it's an actionable intelligence package. The work order contains:
- Asset ID: Critical Water Pump P-101B
- Diagnosis: Stage 2 Outer Race Bearing Fault Detected, Drive-End Motor Bearing.
- Recommendation: Schedule bearing replacement within the next 30 days.
- Required Parts: Automatically pulls the bearing model number and quantity from your asset records.
- Supporting Data: Attaches the vibration trend data and spectrum plot for review by a technician.
The maintenance planner can now schedule this repair during a planned outage, ensuring the parts are on hand and the right personnel are available. This is the seamless, efficient, and proactive process that defines modern maintenance. It's a world away from the panicked scramble of a 2 AM failure. As noted by professional organizations like the American Society of Mechanical Engineers (ASME), this level of integration is a hallmark of top-performing maintenance teams.
Conclusion: A Strategic Decision for a Smarter Factory
Choosing a vibration sensor in 2025 is not about comparing specs on a datasheet in isolation. It's about understanding the entire journey from the microscopic movements on a bearing race to a fully planned and executed work order. It’s a strategic decision that dictates the quality and reliability of your entire predictive maintenance program.
By following the "Data-to-Actionable-Work-Order" playbook, you shift your focus from the hardware to the outcome. You start with the failure modes you need to find, select the right sensor type and specifications to detect them early, and ensure the entire system is integrated to turn that early detection into proactive, planned maintenance. This is how you eliminate unplanned downtime, reduce costs, and transform your maintenance department from a cost center into a strategic competitive advantage.
