Redundancy Definition: Why Your "Backup" System Might Be Your Biggest Risk
Feb 13, 2026
redundancy definition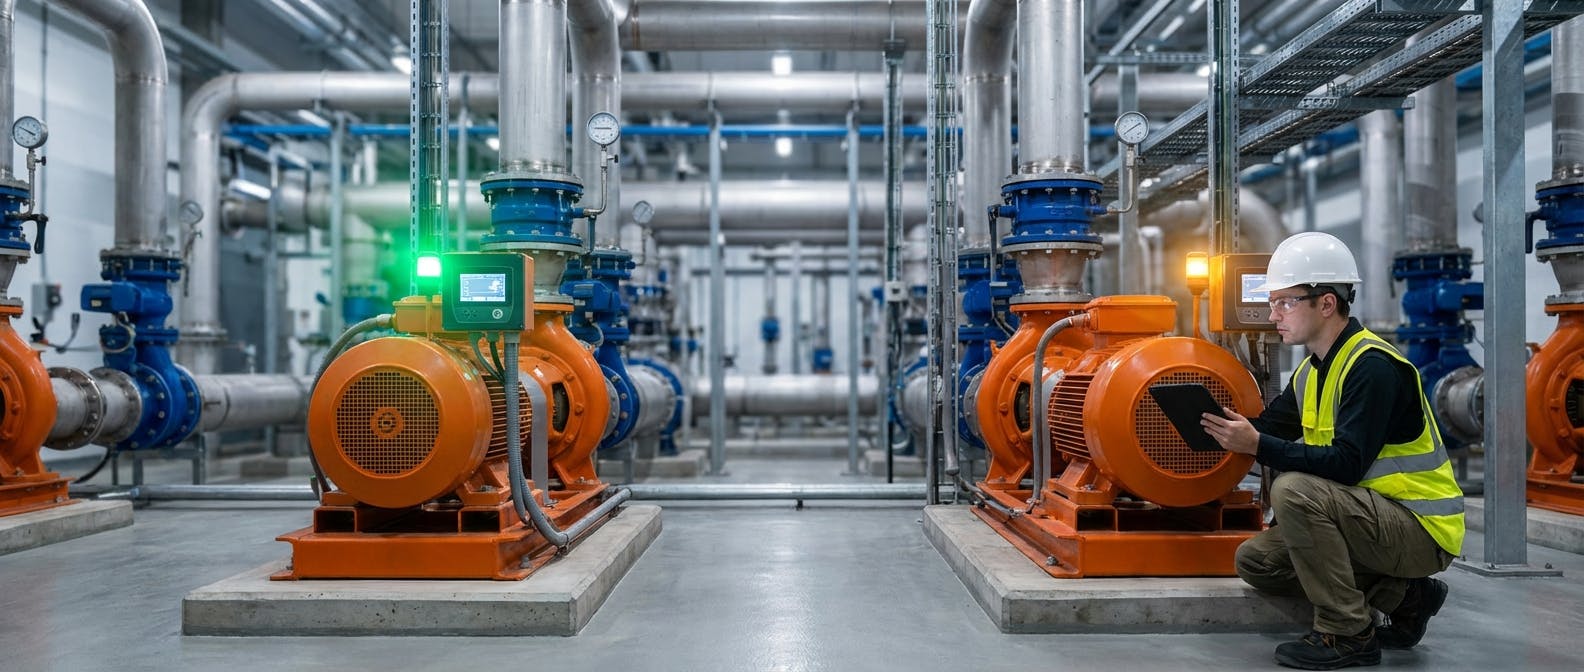
In the world of industrial reliability, "redundancy" is often treated as a simple insurance policy. The logic seems straightforward: if one machine fails, the other takes over. It is the engineering equivalent of wearing a belt and suspenders.
However, for Reliability Engineers and Plant Managers in 2026, the definition of redundancy has evolved. It is no longer just about having a spare; it is about architectural resilience.
Here is the uncomfortable truth that opens our discussion: Redundant assets are often the most dangerous assets in your facility.
Why? Because redundancy creates a false sense of security. We assume the backup is ready to run, but because it sits idle or operates in the background, it is frequently excluded from rigorous condition monitoring. When the primary asset fails—often during a critical production spike—the redundant asset is called upon, only to fail immediately due to "standby rot," seized bearings, or degraded seals.
To truly master system availability, we must move beyond the dictionary definition and understand the engineering mechanics, the cost-benefit trade-offs, and the maintenance strategies required to keep redundancy from becoming a liability.
This guide answers the core question: What is the engineering definition of redundancy, and how do I implement it without creating hidden points of failure?
What Is the Engineering Definition of Redundancy?
At its core, redundancy is the duplication of critical components or functions of a system with the intention of increasing reliability of the system, usually in the form of a backup or fail-safe.
In reliability engineering, we define redundancy mathematically and functionally. It is not merely "having two of something." It is a specific architectural decision to place components in parallel rather than in series.
The Reliability Equation
To understand the definition, you must look at the math.
In a series system (no redundancy), if Component A and Component B must both work for the system to function, the reliability is the product of their individual reliabilities: $$R_{system} = R_A \times R_B$$ If both components are 90% reliable ($0.9$), the system reliability drops to 81% ($0.81$). Every component you add reduces the overall reliability.
In a parallel system (redundancy), the system works if at least one component works. The formula changes to: $$R_{system} = 1 - [(1 - R_A) \times (1 - R_B)]$$ Using the same 90% reliable components, the system reliability jumps to 99%.
System vs. Component Redundancy
The definition splits further into two levels:
- Component Redundancy: Duplicating a specific part within a machine (e.g., dual power supplies in a single server, or double seals on a pump).
- System Redundancy: Duplicating the entire asset (e.g., two completely separate pump skids).
The Core Insight: Redundancy is the only way to make a system more reliable than its individual parts. However, it comes with a massive penalty: increased complexity, increased capital cost, and increased maintenance burden.
What Are the Different Architectures of Redundancy?
Once you understand the basic definition, the next logical question is: "How do I configure these redundant assets?" Not all backups are created equal. The architecture you choose dictates your switchover time, your wear patterns, and your total cost of ownership.
1. Active Redundancy (Load Sharing)
In an active redundancy setup, all redundant components operate simultaneously.
- How it works: If you have two pumps, both run at 50% capacity to meet the 100% demand. If one fails, the other ramps up to 100%.
- Pros: No switchover time (zero interruption); components are known to be functional because they are running.
- Cons: Both assets wear out simultaneously. You risk "Common Mode Failure" where both units reach end-of-life at the exact same moment.
2. Passive (Standby) Redundancy
In this architecture, the primary unit runs while the secondary unit waits. This is further categorized by how "ready" the backup is.
Cold Standby
The backup unit is turned off and effectively disconnected.
- Context: A spare motor sitting in the warehouse or installed but unpowered.
- Trade-off: It preserves the life of the backup asset, but the "Mean Time to Recovery" (MTTR) is high because it takes time to warm up, prime, or install the unit.
Warm Standby
The backup is powered and partially prepared but not taking load.
- Context: A secondary boiler kept at pressure but not feeding steam.
- Trade-off: Faster than cold standby, but consumes energy without producing output.
Hot Standby
The backup is powered, spinning, and fully synchronized, ready to take the load instantly.
- Context: A secondary server mirroring data in real-time, or a generator running at idle.
- Trade-off: Highest energy cost and wear for a non-producing asset, but offers near-instant failover.
3. N+1, N+2, and 2N Redundancy
These terms define the capacity of the redundancy.
- N: The minimum number of units required to meet demand.
- N+1: You have the minimum required plus one spare. If you need 3 cooling towers (N=3) to run the plant, you install 4. This is the most common and cost-effective standard.
- 2N: You have fully mirrored systems (100% redundancy). If you need 3 towers, you install 6. This is usually reserved for life-safety systems or Tier 4 data centers.
For a deeper dive into managing these assets within your digital ecosystem, you can explore our approach to asset management, which allows you to tag assets by their redundancy class (N+1 vs 2N).
How Do I Decide If Redundancy Is Worth the Cost?
A common follow-up question from plant managers is: "I can't afford to buy two of everything. How do I choose where to apply redundancy?"
This is where Criticality Analysis meets Financial Modeling. Redundancy is an expensive solution to reliability. In many cases, it is cheaper to allow a failure and replace the part than to engineer a redundant system.
The Decision Framework: RCM and FMECA
To make this decision, you must utilize Reliability Centered Maintenance (RCM) principles, specifically Failure Mode, Effects, and Criticality Analysis (FMECA).
Ask these three questions:
-
Is the failure mode random or age-related?
- If it is age-related (wear and tear), predictive maintenance is usually a better investment than redundancy. You can see the failure coming and plan for it.
- If it is random (electronic failure, software glitch), redundancy is the only protection.
-
What is the Mean Time to Repair (MTTR)?
- If a motor takes 4 hours to replace, but your process buffer only lasts 1 hour, you need redundancy.
- If the repair takes 30 minutes and you have 4 hours of buffer, redundancy is a waste of capital.
-
Does the cost of downtime exceed the cost of the asset?
- If one hour of downtime costs $50,000 (common in automotive or pharma), and a redundant pump costs $10,000, the ROI is immediate.
- If downtime costs $500/hour, you are better off keeping a spare on the shelf (Cold Standby) rather than installed inline.
The "Hidden" Costs of Redundancy
When calculating ROI, do not forget the operational costs:
- Control Complexity: You need automated switchgear and logic to detect failure and switch loads. This software itself can fail.
- Maintenance Doubling: You now have two machines to grease, align, and inspect.
- Space: Redundant systems increase the physical footprint of the facility.
Why Are Redundant Assets the "Most Dangerous" Equipment?
We touched on this in the introduction, but we need to drill deeper. This is the "Hidden Failure" phenomenon.
In a non-redundant system, a failure is self-revealing. The machine stops, production stops, and everyone knows there is a problem. In a redundant system, a failure is often silent.
The Scenario
Imagine a primary pump (Pump A) and a standby pump (Pump B).
- Pump B's check valve rusts shut because it hasn't cycled in six months.
- No one knows this because Pump A is doing all the work.
- Pump A fails.
- The system attempts to switch to Pump B.
- Pump B fails to start or dead-heads immediately.
- Result: Total system crash, despite having "redundancy."
This is known as a Latent Failure. The protection layer itself has failed, but the failure is hidden until the protection is needed.
The Solution: Proof Testing
To mitigate this, you must implement rigorous "Proof Testing" or "Exercising." This is not just maintenance; it is a functional test.
- Auto-Rotation: Program your PLC to swap Lead/Lag roles every week. This ensures both units remain functional and prevents seals from drying out.
- Staggered Maintenance: Never perform maintenance on redundant pairs at the same time. If you use a bad batch of grease on Pump A, you don't want to use it on Pump B the same day.
For tracking these specific proof tests, utilizing PM procedures that are specifically tagged for "Standby Assets" is crucial. You cannot use standard runtime-based PMs for assets that don't run.
How Should Maintenance Strategies Differ for Redundant Assets?
If you treat your primary and backup assets the same, you are doing it wrong. Their degradation curves are completely different.
1. The "Lead" Unit (Active)
- Strategy: Predictive Maintenance (PdM).
- Tactics: Vibration analysis, oil analysis, thermography.
- Goal: Maximize life and predict end-of-failure.
2. The "Lag" Unit (Passive/Standby)
- Strategy: Preventive Maintenance (PM) & Functional Testing.
- Tactics:
- The "Start-Up" Check: The highest stress on a motor is start-up. Your maintenance must focus on the starting circuit, soft starters, and contactors.
- Environment Protection: Standby units often fail due to external factors (dust, moisture, vibration from the neighbor) rather than internal wear.
- Shaft Rotation: Manually or automatically rotating the shaft to prevent "brinelling" of the bearings (flat spots caused by sitting still while vibrating).
3. Condition Monitoring on Standby Assets
How do you monitor a machine that isn't running? This is a classic dilemma.
- Solution: You must integrate the monitoring into the exercise cycle. Your AI predictive maintenance system should be smart enough to know when the backup turns on for its weekly test, capture the vibration data during that 30-minute window, and then go back to sleep.
How Do I Calculate the Reliability Impact? (The Math)
For the engineers reading this, you need to be able to prove the value of redundancy to your CFO. You need to quantify the reliability gain.
Let’s look at Mean Time Between Failures (MTBF).
If you have two identical components in parallel, the MTBF of the system is significantly higher than the individual components.
For a system with two identical active redundant units (where failure rate $\lambda$ is constant): $$MTBF_{system} = \frac{3}{2\lambda}$$ (Note: This assumes constant failure rates and independent failures).
However, the real world is messier. We must account for Common Mode Failures (CMF). CMF occurs when a single event causes both redundant parts to fail.
- Examples: A power surge, a flooded room, a software bug in the controller, or a bad batch of spare parts.
If your Common Mode Failure probability is high (e.g., 10%), your redundancy is effectively useless.
- Best Practice: Design for diversity. Use different cable routes for power. If possible, use different technologies (e.g., an electric pump backed up by a diesel pump). This eliminates the dependency on the electrical grid.
For a deeper understanding of reliability calculations and standards, the NIST Engineering Statistics Handbook is an excellent resource for the statistical models behind redundancy.
How Does AI and Digital Transformation Change Redundancy?
As we move through 2026, the concept of "Virtual Redundancy" is emerging.
Virtual Redundancy
Traditionally, redundancy meant "extra hardware." Today, software can sometimes replace hardware.
- Example: In a sensor network, if a temperature sensor fails, AI can infer the temperature based on pressure and flow data from surrounding sensors. This is "Analytical Redundancy." It allows you to keep running safely without a physical backup sensor.
Predictive vs. Redundant
There is a growing trend to trade redundancy for superior prediction.
- The Logic: If I can predict a failure with 99.9% accuracy 3 weeks in advance using prescriptive maintenance, do I really need a $50,000 standby unit sitting there?
- The Shift: Companies are moving from "Just-in-Case" (Redundancy) to "Just-in-Time" (Predictive Maintenance).
- The Risk: This requires high confidence in your PdM system. If the AI misses the prediction, you have no safety net.
Inventory Redundancy
Redundancy also applies to your MRO (Maintenance, Repair, and Operations) inventory. Do you keep the spare part on the shelf (Inventory Redundancy) or installed on the line (System Redundancy)?
- Integrated inventory management software helps calculate the cost of carrying that inventory versus the risk of downtime, helping you optimize stock levels based on lead times.
Implementation Framework: From Assessment to Execution
If you are ready to audit your facility's redundancy, follow this step-by-step framework.
Step 1: The Criticality Audit
Map every asset in your facility. Assign a criticality score (1-10) based on safety, environmental impact, and production loss.
- Action: Identify assets with a score of 8+ that currently have NO redundancy (Single Points of Failure - SPOF).
Step 2: The Feasibility Study
For the SPOFs identified, determine if physical redundancy is possible.
- Is there floor space?
- Can the piping/wiring accommodate a parallel path?
- Decision: If physical redundancy is impossible, you must increase the "Logical Redundancy" (spare parts on site + rigorous PdM).
Step 3: Select the Architecture
Choose between Active (N+1) or Passive (Standby).
- Use Active if the switchover must be seamless.
- Use Passive if you want to extend the total life of the equipment fleet.
Step 4: Define the "Switchover Logic"
How does the system know to switch?
- Manual: Operator notices a red light and turns a valve. (High risk, slow).
- Automatic: PLC detects low pressure and auto-starts the lag pump. (Requires sensor redundancy—if the pressure sensor fails, the switchover fails).
Step 5: Implement the "Exercise" PMs
Create recurring work orders to force-start the standby units.
- Benchmark: Run standby units for at least 30 minutes every 2 weeks to circulate fluids and coat bearings.
Step 6: Address Common Mode Failures
Look for the shared dependencies.
- Do both units share one breaker panel?
- Do both rely on the same cooling water loop?
- Action: Segregate these utilities where possible.
Conclusion
Redundancy is not a "set it and forget it" strategy. It is a dynamic state of engineering that requires constant vigilance. While it is the most effective way to achieve high availability (99.99% and above), it introduces complexity that can mask failures until it is too late.
The definition of redundancy in 2026 includes the hardware, the software that manages the switchover, and the maintenance strategy that preserves the backup.
Your Takeaway: Go to your facility floor tomorrow. Find your "Standby" equipment. Check the last time it was run. If the answer is "I don't know," you don't have redundancy—you have a paperweight.
For more insights on optimizing your maintenance strategy beyond simple redundancy, explore our guide on work order software to ensure your standby checks never slip through the cracks.
