Predictive vs. Preventive Maintenance: The 2025 Financial Decision-Maker's Guide
Aug 8, 2025
predictive vs. preventive maintenance: which is right for your facility?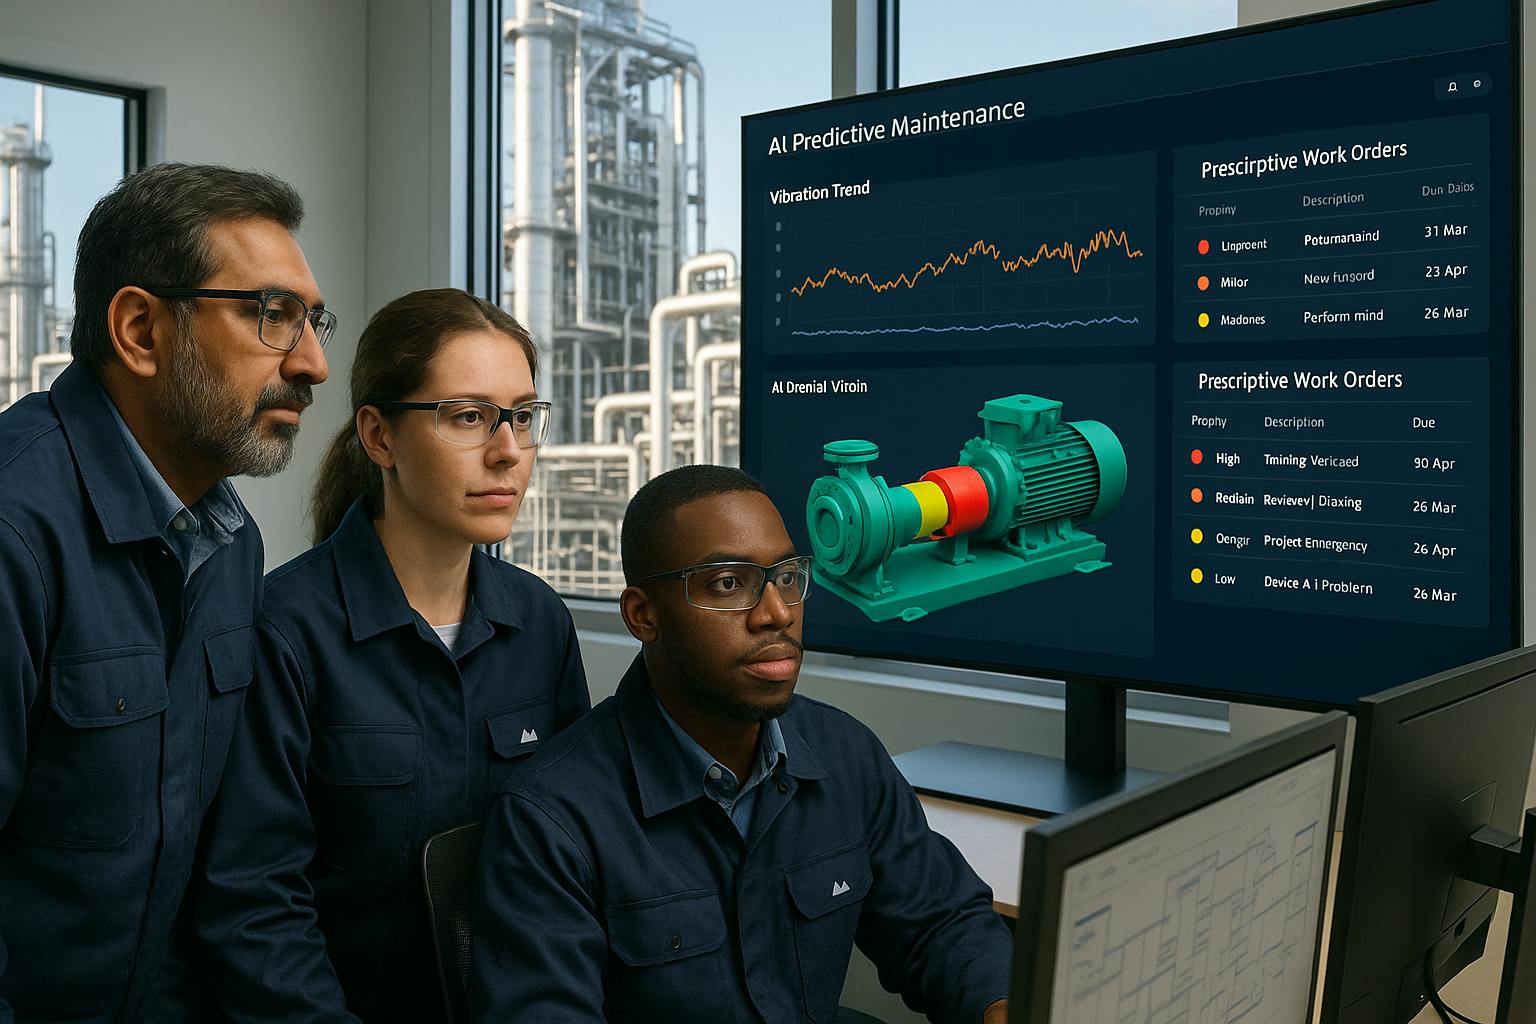
The conversation around your facility's maintenance budget is changing. For decades, it was viewed as a necessary cost center—an operational expense to be minimized. But in 2025, leading facility operators and financial decision-makers understand the truth: your maintenance strategy is one of the most powerful levers you can pull for profitability, efficiency, and competitive advantage.
You're likely past the point of basic definitions. You already know that preventive maintenance (PM) is time- or usage-based ("change the oil every 5,000 miles"), while predictive maintenance (PdM) is condition-based ("change the oil when sensors indicate its viscosity has degraded").
The real question isn't "What are they?" but rather, "How do I build a financially optimized strategy that leverages both?" The debate is no longer about picking one over the other. It's about designing a blended, intelligent approach tailored to the unique financial and operational realities of your facility.
This guide is for you. We'll move beyond the pros and cons and provide a strategic framework for making data-backed decisions. We'll explore how to use asset criticality, the P-F Curve, and Overall Equipment Effectiveness (OEE) to determine where to invest in advanced predictive technologies and where to rely on tried-and-true preventive schedules. This is your blueprint for transforming maintenance from an expense into a strategic investment.
Beyond the Basics: Reframing the PM vs. PdM Debate in 2025
To build a modern maintenance strategy, we first need to reframe the core concepts from a strategic perspective. The goal has evolved from simply preventing failure to optimizing every aspect of an asset's lifecycle for maximum value.
The Evolution from "Fix It Before It Breaks" to "Fix It at the Perfect Time"
Traditional preventive maintenance was a revolutionary step up from the chaos of reactive, run-to-failure models. By scheduling maintenance based on manufacturer recommendations or historical data, facilities gained a semblance of control. However, this approach has inherent financial and operational flaws:
- The Cost of Over-Maintenance: A significant portion of PM tasks are performed on perfectly healthy components. You replace parts that still have 40% of their useful life remaining. This is not just wasted material cost; it's wasted labor, planned downtime, and the introduction of risk (infant mortality) every time a machine is opened up.
- The Risk of Under-Maintenance: A calendar-based schedule doesn't account for variations in operating conditions, material quality, or usage intensity. An asset might be run harder than average, causing it to fail before its scheduled PM, leading to the very unplanned downtime you sought to avoid.
This is where the P-F Curve becomes an essential mental model for any maintenance strategist.
(Image description: A graph showing the P-F Curve. The Y-axis is "Asset Condition" and the X-axis is "Time". The curve slopes downward from "Good" to "Failure". A point "P" (Potential Failure) is marked high on the curve, where a defect is first detectable by predictive technologies. A point "F" (Functional Failure) is marked at the bottom of the curve, where the asset can no longer perform its function. The P-F Interval is the time between these two points, representing the window for proactive maintenance.)
The P-F Curve illustrates an asset's journey from health to failure.
- Point P (Potential Failure): The moment a physical condition change occurs that could lead to failure. This is often invisible to human senses but detectable by technologies like vibration analysis or infrared thermography.
- Point F (Functional Failure): The moment the asset can no longer perform its intended function to specification.
Preventive maintenance often schedules work arbitrarily along this curve, hoping to catch it before Point F. Predictive maintenance is designed to detect Point P, giving you the entire P-F Interval to plan, schedule, and execute a repair with maximum efficiency and minimal disruption. The goal of PdM is to give you the gift of time—time to order parts, schedule labor during a planned shutdown, and avoid a catastrophic, production-halting event.
Why "Which One?" is the Wrong Question
Viewing this as a binary choice is the most common strategic mistake. The most efficient, cost-effective, and resilient facilities in 2025 do not run on 100% predictive maintenance. Nor do they rely solely on preventive schedules. They run on a blended strategy.
The right question is not "PM or PdM?" but "Which strategy for which asset?"
A multi-million-dollar CNC machine that is the linchpin of your entire production line demands the sophisticated oversight of predictive maintenance. The rooftop HVAC unit that cools the administrative offices, while important, can likely be managed effectively with a robust preventive maintenance program. The lightbulbs in the breakroom? A run-to-failure approach is perfectly acceptable.
This asset-by-asset decision-making process is the core of a modern maintenance program. It requires a financial framework to justify the investment and a strategic blueprint to guide implementation.
The Financial Framework: Calculating the ROI of Your Maintenance Strategy
To get buy-in from the C-suite and justify your budget, you must speak the language of finance. This means moving beyond technical jargon and framing maintenance decisions in terms of ROI, cost avoidance, and productivity gains.
The True Cost of Downtime: Your Most Important Metric
The foundation of your financial justification is a realistic calculation of the Total Cost of Downtime. It's far more than just a silent production line. A comprehensive calculation should include:
- Lost Production Value: The revenue from products not made during the outage.
- Wasted Labor: Idle operators and technicians waiting for repairs.
- Repair Costs: Overtime for maintenance staff, rush shipping for parts, and potential contractor fees.
- Wasted Raw Materials: Product scrapped on the line at the time of failure.
- Supply Chain Ripple Effects: Expedited shipping costs to customers, contractual penalties for late delivery.
- Reputational Damage: Lost customer trust and future orders.
Once you have a credible per-hour downtime cost for your critical assets, the value of PdM becomes crystal clear. If a critical motor costs you $20,000 per hour in downtime, investing $5,000 in a sensor and software solution that prevents just one hour of unplanned downtime per year yields an immediate positive ROI.
This ties directly into Overall Equipment Effectiveness (OEE), a gold-standard metric for measuring manufacturing productivity. OEE is calculated as:
OEE = Availability x Performance x Quality
- Availability: (Run Time / Planned Production Time). Unplanned downtime from equipment failure directly kills your Availability score.
- Performance: (Ideal Cycle Time x Total Count) / Run Time. Failures can lead to running equipment at slower speeds.
- Quality: (Good Parts / Total Parts). Failing equipment often produces more defects before it stops completely.
Improving your maintenance strategy is one of the most direct ways to boost your OEE score, a metric that resonates powerfully with operations and finance leaders. For a deeper dive into OEE calculations, iSixSigma provides excellent resources on the topic.
Cost-Benefit Analysis: PM vs. PdM
To make an informed choice for a specific asset, you need a clear-eyed comparison of the costs.
| Cost Category | Preventive Maintenance (PM) | Predictive Maintenance (PdM) |
|---|---|---|
| Upfront Investment | Low. Primarily planning and scheduling time. | High. IIoT sensors, software platforms, potential network upgrades. |
| Recurring Software/Data | Low. Basic CMMS scheduling features. | Moderate to High. Subscription fees for advanced AI predictive maintenance platforms. |
| Labor Costs | High & Recurring. Technicians perform tasks on a fixed schedule, regardless of asset health. | Lower for routine tasks. Higher for specialized analysis (e.g., certified vibration analyst), but work is only done when needed. |
| Parts/Inventory Costs | High. Parts are replaced based on a calendar, often prematurely. Requires holding more inventory. | Optimized. Parts are ordered just-in-time based on failure predictions, reducing inventory carrying costs. |
| Downtime Costs | Planned downtime for scheduled PMs. Risk of unplanned downtime if schedule is misaligned with actual wear. | Drastically reduced unplanned downtime. Maintenance can be scheduled during planned outages. |
The financial case for PdM on a critical asset is built on demonstrating that the high upfront investment is dwarfed by the long-term savings from eliminating unplanned downtime, optimizing labor, and extending the useful life of expensive components.
The Role of Mean Time Between Failures (MTBF)
Mean Time Between Failures (MTBF) is a foundational reliability metric, calculated as:
MTBF = Total Uptime / Number of Breakdowns
In a traditional PM program, MTBF is often used to set the maintenance interval. If an asset historically fails every 2,000 hours, a PM might be scheduled at 1,800 hours. The problem is that this is an average; some will fail at 1,500 hours, and others could run to 3,000.
A PdM strategy fundamentally changes your relationship with MTBF. Instead of being a historical data point used for scheduling, the goal of PdM is to actively extend the MTBF of your assets. By catching small issues like imbalance or poor lubrication early, you prevent the cascading damage that leads to major failure, pushing the next breakdown further into the future.
The Strategic Blueprint: Implementing a Blended Maintenance Program
With the financial framework in place, you can now build a practical, step-by-step plan to implement a blended strategy. This isn't about flipping a switch overnight; it's a phased, deliberate process.
Step 1: Conduct a Thorough Asset Criticality Analysis (ACA)
You cannot treat every asset equally. An Asset Criticality Analysis (ACA) is a systematic process for ranking your equipment based on its impact on the business. This is the single most important step in designing your maintenance strategy.
To perform an ACA, score each asset against several factors, such as:
- Impact on Safety: What are the consequences of failure for employee safety?
- Impact on Production: Does failure stop a single process or the entire plant?
- Cost of Repair: What is the typical cost in parts and labor to fix a failure?
- Impact on Quality: Does failure lead to product defects or scrap?
- Redundancy: Is there a backup asset that can take over immediately?
You can use a simple matrix to categorize your assets:
| Criticality Level | Description | Primary Maintenance Strategy | Example |
|---|---|---|---|
| High (Critical) | Failure causes major safety risk, plant-wide shutdown, or massive financial loss. No redundancy. | Predictive Maintenance (PdM) | Main production line conveyor motor, primary plant air compressor. |
| Medium (Important) | Failure causes significant disruption, high repair costs, or quality issues. Limited or no redundancy. | Preventive Maintenance (PM) | Secondary processing equipment, building HVAC systems, forklifts. |
| Low (Non-Critical) | Failure has minimal impact on production or safety. Inexpensive to repair or has built-in redundancy. | Reactive Maintenance (Run-to-Failure) | Office lighting, non-essential pumps, redundant equipment. |
This analysis immediately tells you where to focus your resources. Your High-Criticality assets are the prime candidates for a predictive maintenance program.
Step 2: Matching the Strategy to the Asset (The Matrix in Action)
Once your ACA is complete, you can formally assign a primary maintenance strategy to each asset class.
- For your High-Criticality Assets, implement Predictive Maintenance (PdM): This is where you deploy your technology stack. For example, for a critical gearbox, you would install vibration and temperature sensors. For a bank of electrical cabinets, you would schedule regular infrared thermography scans. The goal is maximum visibility into asset health to preempt failure. A great example is applying PdM to critical industrial motors, which can be explored further in our guide on predictive maintenance for motors.
- For your Medium-Criticality Assets, design a robust Preventive Maintenance (PM) program: These assets justify the cost of planned maintenance but not necessarily the high-tech investment of full PdM. Use a modern CMMS software to schedule and track recurring tasks like lubrication, filter changes, and calibrations. The key is to base these schedules on a combination of manufacturer recommendations, historical data, and operating hours.
- Clarifying Condition-Based Maintenance (CBM): CBM is often used as a synonym for PdM, but it can also refer to a simpler form of condition monitoring. For example, a PM task might be "Check the pressure gauge on Pump X-101 every Monday. If pressure is below 50 PSI, create a work order." This is condition-based, but it relies on manual inspection rather than continuous, automated sensing. CBM can be a great intermediate step for medium-criticality assets.
- For your Low-Criticality Assets, use a deliberate Reactive Maintenance strategy: This is not the same as neglect. It's a conscious decision that it is more cost-effective to repair or replace these assets when they fail than to invest in proactive maintenance. The key is to ensure you have the necessary spare parts and procedures in place for a quick fix.
Step 3: Choosing Your Tools - The Technology Stack for Modern Maintenance
A successful blended strategy relies on a powerful, integrated technology stack with a Computerized Maintenance Management System (CMMS) at its core.
- IIoT (Industrial Internet of Things) Sensors: These are the eyes and ears of your PdM program. Common types include:
- Vibration Sensors: Detect imbalance, misalignment, and bearing wear in rotating equipment.
- Thermal Sensors: Identify overheating in electrical panels, motors, and friction points.
- Acoustic Sensors: "Hear" high-frequency sounds from air leaks or early-stage faults.
- Pressure Transducers: Monitor fluid and gas systems for performance degradation.
- The CMMS: Your Central Nervous System: A modern CMMS is essential. It's where sensor data becomes actionable intelligence. A capable CMMS will:
- Integrate with IIoT sensors to receive alerts.
- Automatically generate work orders when a predictive threshold is breached.
- Manage your entire PM schedule, triggering tasks based on time or usage meters.
- House all asset history, documentation, and spare parts information.
- Provide powerful reporting and analytics to track KPIs like MTBF and OEE.
- Leverage features like work order software to streamline the entire process from fault detection to resolution.
Deep Dive: Mastering Predictive Maintenance (PdM) Implementation
For many facilities, implementing PdM is the most challenging—and most rewarding—part of modernizing their maintenance strategy. It requires a new way of thinking and a structured approach.
Common PdM Techniques and Their Applications
Understanding the primary PdM technologies helps you match the right tool to the right failure mode.
- Vibration Analysis: The cornerstone of rotating equipment health monitoring. Certified analysts can interpret vibration signatures to pinpoint the exact cause of a developing fault—be it a bearing flaw, shaft misalignment, or structural looseness—long before it becomes catastrophic. This technique is so foundational that many organizations rely on expert resources like Reliabilityweb for training and certification.
- Infrared Thermography: Uses thermal cameras to visualize temperature differences. It's incredibly effective for finding "hot spots" in electrical cabinets caused by loose connections, overloaded circuits, or failing components. It's also used to detect friction in mechanical systems and insulation breakdown.
- Oil Analysis: Akin to a blood test for your machinery. A lab analysis of an oil sample can reveal microscopic metal particles (indicating component wear), chemical breakdown of the lubricant, and contamination from water or other fluids.
- Acoustic Analysis: Uses ultrasonic sensors to detect high-frequency sounds that are inaudible to the human ear. This is a premier method for finding costly compressed air or gas leaks and is also highly effective for detecting early-stage bearing faults.
- Motor Circuit Analysis (MCA): A de-energized test method that provides a comprehensive health assessment of a motor's entire electrical system, including windings, rotor, and cabling.
A Phased Rollout Plan for PdM
Don't try to boil the ocean. A successful PdM implementation is a marathon, not a sprint.
- Phase 1: Pilot Program (3-6 months): Select 3-5 of your most critical assets identified in your ACA. Choose assets with known failure modes that align well with a specific PdM technology (e.g., a large, critical motor for vibration analysis). The goal is to prove the concept, learn the technology, and generate a clear ROI case study to secure broader support.
- Phase 2: Data Collection & Baselining (1-3 months): Once sensors are installed, let them run. You need to collect enough data to establish what "normal" looks like for that asset under various operating conditions. This baseline is crucial for setting meaningful alert thresholds.
- Phase 3: Setting Alert Thresholds: Work with your technology provider or internal experts to define alarm levels. Typically, you'll have a two-tiered system: a lower-level "alert" that signals a need for further investigation, and a higher-level "alarm" that automatically triggers a high-priority work order.
- Phase 4: Integration and Scaling: This is where the magic happens. Integrate your sensor platform directly with your CMMS. An alarm should automatically create a detailed work order, assign it to the right technician, and even check inventory for the necessary parts. Once your pilot program is a proven success, use your ROI data to justify a systematic expansion to all other high-criticality assets.
The Human Element: Training Your Team for a PdM Future
Technology is only half the equation. Your team's skills must evolve. A PdM-driven environment requires a shift from purely mechanical skills to include data analysis and interpretation. Invest in training your technicians. Certifications in vibration analysis, thermography, and other NDT (Non-Destructive Testing) methods will be invaluable. This upskilling not only makes your program more effective but also increases employee engagement and provides clear career progression paths.
The Future is Now: From Predictive to Prescriptive Maintenance (RxM)
As you master predictive maintenance, the next frontier is already here: Prescriptive Maintenance (RxM). If PdM tells you "what" will fail and "when," RxM tells you "what to do about it."
What is Prescriptive Maintenance (RxM)?
Prescriptive maintenance is the next logical evolution, powered by advanced AI and machine learning. It doesn't just predict a failure; it analyzes a vast array of data to recommend the optimal solution.
- Predictive Alert: "Vibration analysis indicates a 95% probability of bearing failure on Pump A-102 within the next 150 operating hours."
- Prescriptive Recommendation: "Bearing failure on Pump A-102 is imminent. The optimal response is to:
- Order part #789-B from Supplier X (current lead time is 3 days, cost is $450).
- Schedule 3 hours of maintenance for Technician B (who has the highest success rate for this repair).
- Perform the repair during the scheduled line changeover next Tuesday at 2:00 AM to eliminate production impact.
- Here is the link to the standard operating procedure for this specific repair."
How RxM Works
This level of intelligence is achieved by allowing an AI engine to synthesize data from multiple, previously siloed systems:
- PdM Sensor Data (the "what" and "when")
- CMMS Data (asset history, repair procedures, technician skills)
- ERP/Inventory System Data (part availability, supplier lead times, cost)
- Production Scheduling System Data (planned downtime, line changeovers)
By analyzing all these variables, a prescriptive maintenance engine can run thousands of simulations to find the single most cost-effective, least disruptive course of action. It's about moving from data-driven alerts to AI-driven decisions. As noted by standards bodies like NIST, this level of system integration is a hallmark of advanced manufacturing.
Conclusion: Building Your Facility's Optimal Maintenance Mix
The choice between predictive and preventive maintenance is not a simple "either/or." The most competitive, resilient, and profitable facilities of 2025 operate on a sophisticated, blended strategy that is meticulously tailored to their specific operational environment.
The path forward is clear:
- Start with a Financial Mindset: Frame every decision in terms of ROI, OEE, and the total cost of downtime.
- Perform a Rigorous Asset Criticality Analysis: Let data, not habit, determine where you invest your resources.
- Match the Strategy to the Asset: Deploy high-tech PdM for your most critical assets, rely on robust PM for important but less critical equipment, and be deliberate about using a run-to-failure approach for non-essential components.
- Invest in an Integrated Technology Stack: Make a modern CMMS the central hub of your operations, connecting sensor data, work orders, and asset history into a single source of truth.
- Look to the Future: Build your predictive program with an eye toward the ultimate goal of prescriptive maintenance, where AI helps you optimize not just asset health, but your entire operational workflow.
This strategic approach transforms your maintenance department from a cost center into a powerful engine for creating value. It's an investment in uptime, quality, and a sustainable competitive advantage.
Ready to see how a modern platform can manage this blended strategy? Explore how our Predictive Maintenance solutions can help you get started on your journey to operational excellence.
