Vibration Analysis: From Predictive Data to Prescriptive Action in 2025
Aug 6, 2025
vibration analysis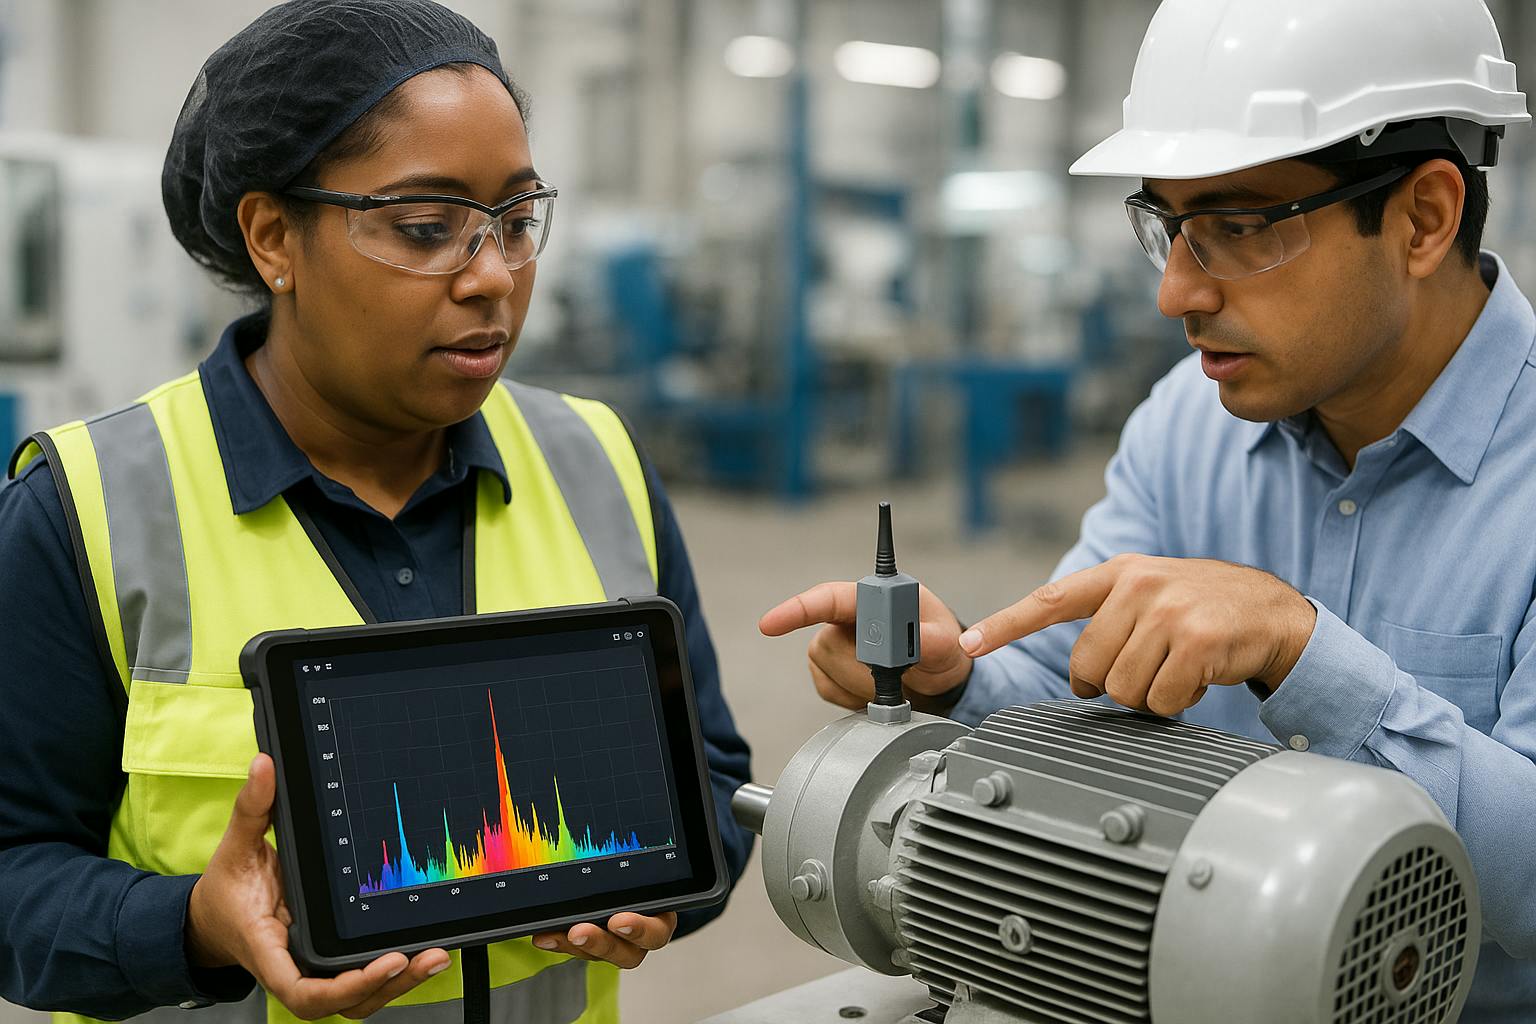
Unplanned downtime. It’s the phrase that haunts every maintenance manager and plant operator. The sudden, screeching halt of a critical asset doesn't just stop a production line; it triggers a cascade of costly consequences—lost revenue, frantic repair efforts, overtime pay, and compromised safety. For decades, the primary defense was reactive or preventive maintenance. But in 2025, waiting for something to break or replacing parts on a fixed schedule is no longer a competitive strategy. The new benchmark is predictive, and its most powerful tool is vibration analysis.
Think of vibration analysis as the stethoscope for your machinery. It allows you to listen to the subtle, internal whispers of your equipment, detecting the earliest signs of wear, stress, and impending failure long before they become catastrophic. But this isn't just about collecting squiggly lines on a screen. True value is unlocked when you transform that data into decisive, planned action.
This comprehensive guide moves beyond a simple "what is" definition. We will dive deep into the operationalization of vibration analysis, providing a blueprint for integrating this technology into your daily workflow, connecting it to your core systems, and building a culture of proactive reliability that drives bottom-line results.
What is Vibration Analysis? (And Why It's More Than Just Wiggles on a Screen)
At its core, vibration analysis is the process of measuring the vibration of machinery, analyzing the data, and using that information to determine the health of the equipment and identify specific developing faults. It's a non-intrusive method, meaning you can gather data while the machine is in its normal operating state, causing zero disruption to production.
The Core Principle: Every Machine Has a Unique Vibrational Signature
Just like a human fingerprint, every healthy machine has a unique and repeatable vibration pattern, known as its "baseline signature." This signature is the sum of all the tiny movements and forces inherent in its design and operation—the hum of the motor, the meshing of gears, the rotation of the bearings.
When a component begins to degrade, it introduces new or different forces, altering this baseline signature in a predictable way. A developing imbalance creates a different pattern than a failing bearing, which in turn is different from gear tooth wear. The goal of vibration analysis is to detect and interpret these changes.
The Language of Vibration: Key Metrics Explained
To understand the story the vibration data is telling, analysts focus on three key parameters. It’s the combination of these metrics that allows for precise diagnostics.
Amplitude (The Severity)
Amplitude measures the intensity or magnitude of the vibration. It answers the question, "How much is it shaking?" A higher amplitude generally indicates a more severe problem. It can be measured in three ways:
- Displacement: The total distance the component is moving back and forth (measured in mils or microns). It's most useful for very low-frequency vibrations, like those found in large, slow-turning shafts.
- Velocity: The speed at which the component is moving (measured in inches per second or millimeters per second). Velocity is the most common and broadly useful metric for general machine health assessment, as it provides a direct correlation to the destructive energy of the vibration across a wide frequency range.
- Acceleration: The rate of change of velocity (measured in Gs, where 1 G is the force of gravity). Acceleration is highly sensitive to high-frequency events, making it ideal for detecting the very first signs of bearing and gearbox faults.
Frequency (The Cause)
Frequency measures how often the vibration occurs, typically expressed in Hertz (Hz, cycles per second) or CPM (cycles per minute). This is arguably the most critical diagnostic parameter because different machine faults generate vibration at specific, calculable frequencies. For example:
- An imbalance in a fan running at 1800 RPM will produce a strong vibration signal at a frequency of 1800 CPM (or 30 Hz).
- A misaligned coupling might show a peak at 2x the running speed (3600 CPM).
- A specific fault on a bearing inner race will generate a unique frequency based on the bearing's geometry and the machine's speed.
By matching the frequencies present in the data to the known fault frequencies of the machine, an analyst can pinpoint the root cause of the problem with incredible accuracy.
Phase (The Character)
Phase is a timing measurement that describes how one part of a machine is moving in relation to another, or in relation to a fixed timing reference. By placing sensors at different points on a machine (e.g., on both ends of a motor), phase analysis can help differentiate between issues that might look similar in the frequency spectrum. For instance, it can clearly distinguish between an imbalance (which is typically in-phase across a component) and a specific type of misalignment (which can be 180 degrees out-of-phase).
From Raw Data to Actionable Insight: The Role of FFT
A running machine produces a highly complex vibration signal, with dozens of different frequencies all happening at once. Looking at this raw data, called a time waveform, can be overwhelming. This is where the Fast Fourier Transform (FFT) comes in.
The FFT is a mathematical algorithm that acts as a prism for vibration data. It takes the complex, jumbled time waveform signal and breaks it down into its individual component frequencies. The result is a frequency spectrum (or FFT plot), a simple graph that shows the amplitude of vibration at each specific frequency. This plot makes it easy for an analyst to see the dominant frequencies and compare them to the known fault frequencies of the machine, turning a chaotic signal into a clear diagnostic chart.
The Anatomy of a Modern Vibration Analysis Program
A successful program in 2025 is a symbiotic system of hardware, software, and human expertise. Each component is critical for turning raw vibrations into reliable outcomes.
The Hardware: Gathering the Data
The quality of your analysis is fundamentally limited by the quality of your data. Choosing the right sensors and using them correctly is the first and most important step.
- Accelerometers: These are the workhorses of vibration analysis. An accelerometer is a sensor that measures acceleration. Inside most industrial accelerometers is a piezoelectric crystal that, when stressed by movement, generates a tiny electrical charge proportional to the acceleration. This signal is then sent to a data collector. Modern MEMS (Micro-Electro-Mechanical Systems) accelerometers are also becoming common, especially in wireless sensors, offering small size and low power consumption.
- Mounting is Critical: How you attach the sensor to the machine dramatically affects data quality. A stud-mounted sensor, screwed directly into a tapped hole on the machine casing, provides the best possible frequency response and is the gold standard. A powerful two-pole magnetic base is the most common method for portable data collection, offering a good balance of convenience and accuracy. Adhesive mounting is used for temporary installations or on surfaces where drilling is not possible.
- Wireless vs. Wired Sensors: For years, data was collected via "walk-around" routes with a portable data collector and a wired accelerometer. This is still a valid and cost-effective method for many assets. However, the IIoT (Industrial Internet of Things) revolution has made wireless sensors a powerful alternative.
- Wireless Sensors: These are battery-powered sensors that are permanently mounted on an asset and transmit data wirelessly to a central gateway. They are ideal for hard-to-reach or unsafe locations, and for critical machinery that requires more frequent (even continuous) monitoring.
- Wired Systems: These are typically reserved for the most critical, high-speed machinery like large turbines and compressors, where continuous, high-resolution data is non-negotiable.
The Software: Interpreting the Signals
The software platform is where the data is stored, analyzed, and visualized. Modern platforms have evolved far beyond simple plotting tools. In 2025, you should expect:
- Cloud-Based Platforms: Allowing secure access to data from anywhere, facilitating collaboration between on-site technicians and remote expert analysts.
- AI and Machine Learning: The sheer volume of data from wireless sensors makes manual analysis impractical. AI-powered predictive maintenance algorithms can automatically screen incoming data, compare it to established patterns, and flag only the assets that show meaningful deviations. This allows analysts to focus their time on diagnostics, not data sifting.
- Automated Diagnostics: Advanced systems can now provide a "first-pass" diagnosis, suggesting likely faults based on the frequency patterns detected. For example, the software might automatically flag a high 1x RPM peak with a note: "High probability of imbalance."
The People: The Analyst's Critical Role
Despite the advances in AI, the certified human analyst remains the heart of the program. Technology can flag an anomaly, but it often takes an experienced analyst to consider the full context—the machine's history, its operating environment, and other condition monitoring data—to make a confident and accurate diagnosis.
According to the ISO 18436 standard, analysts are certified in different categories (Category I to IV), with increasing levels of expertise in data acquisition, diagnostics, and program management. A successful program fosters a partnership between the analyst who interprets the data and the maintenance technician who knows the machine intimately and performs the corrective work.
Decoding the Signals: A Practical Guide to Machinery Diagnostics
The true power of vibration analysis lies in its ability to identify specific problems. Here is a guide to some of the most common machinery faults and their corresponding vibrational signatures.
Imbalance: The Most Common Culprit
Imbalance occurs when the center of mass of a rotating component is not aligned with its center of rotation. Think of the feeling of an out-of-balance tire on your car.
- Vibration Signature: A classic imbalance is characterized by a high-amplitude vibration peak at exactly 1x the running speed of the component. The vibration is radial (up-and-down or side-to-side) and is typically uniform in all radial directions.
- Common Causes: Buildup of material on fan blades or pump impellers, a broken or missing component, uneven wear, or manufacturing defects.
- Actionable Insight: The detection of a 1x RPM peak signals the need to schedule a balancing procedure. This is a planned, corrective task, not an emergency repair.
Misalignment: The Silent Killer of Bearings and Seals
Misalignment occurs when the centerlines of two coupled shafts (like a motor and a pump) are not collinear. This strain puts immense stress on bearings, seals, and couplings, leading to premature failure of multiple components.
- Vibration Signature: Misalignment signatures can be more complex than imbalance. The most common indicator is a high-amplitude peak at 2x the running speed (2x RPM). Often, you will also see a significant peak at 1x RPM. High axial vibration (in the direction of the shaft) is another strong indicator. The specific shape of the 1x and 2x peaks can help differentiate between angular misalignment (where shafts meet at an angle) and parallel misalignment (where shafts are parallel but offset).
- Common Causes: Improper installation, thermal growth (as machines heat up, their alignment changes), or shifting foundations.
- Actionable Insight: A 2x RPM peak is a clear signal to schedule a precision laser alignment. Performing this corrective action can dramatically extend the life of bearings and seals.
Mechanical Looseness: The Rattle and Hum
Looseness creates impact events that generate a distinct vibration pattern. There are three main types:
- Type A (Structural Looseness): Loose mounting bolts on the machine feet or cracks in the foundation or frame. The signature is typically high vibration at 1x RPM, but can also show peaks at 2x, 3x, and 4x RPM.
- Type B (Rotating Looseness): Looseness in a rotating assembly, such as a bearing that is loose in its housing. This often shows up as multiple harmonics (multiples of running speed).
- Type C (Component Looseness): Looseness between two components, like a worn fit in a bearing. This often generates a series of many, many harmonics, sometimes called "a haystack" in the spectrum.
- Actionable Insight: The detection of multiple harmonics is a trigger to perform a physical inspection. This involves checking bolt torque, looking for cracks, and inspecting component fits during the next planned outage.
Bearing Failures: The Four Stages of Decay
Vibration analysis is exceptionally effective at detecting bearing faults, often providing weeks or even months of warning. This is a cornerstone of any predictive maintenance program.
- Vibration Signature: Bearing failure is a process, and the vibration signature evolves through four distinct stages:
- Stage 1 (Ultrasonic): The very first microscopic cracks and spalls generate stress waves and impacts at very high frequencies (typically above 20,000 Hz), which are detected by acceleration measurements.
- Stage 2 (Fundamental Frequencies): As the defects grow, they begin to "ring" at the bearing's unique fundamental fault frequencies: BPFI (Ball Pass Frequency, Inner Race), BPFO (Ball Pass Frequency, Outer Race), BSF (Ball Spin Frequency), and FTF (Fundamental Train Frequency). These frequencies can be calculated precisely based on the bearing's geometry.
- Stage 3 (Harmonics): As the damage worsens, harmonics of the fundamental fault frequencies appear, and the 1x RPM running speed vibration may increase as the bearing becomes loose.
- Stage 4 (Noise Floor): In the final stage before seizure, the bearing components are so damaged that they generate random, broadband vibration, causing the entire "noise floor" of the spectrum to rise. The distinct fault frequencies may even disappear, masked by the noise.
- Actionable Insight: Detecting a Stage 1 or Stage 2 fault is the goal. This provides maximum lead time to plan the repair. An alert for a bearing fault frequency should trigger a work order to procure a new bearing and schedule the replacement at the most convenient time. This is a perfect use case for a dedicated solution for predictive maintenance on bearings.
Gearbox Issues: A Complex Symphony of Frequencies
Gears produce their own unique set of frequencies, making analysis complex but powerful.
- Vibration Signature: The primary frequency is the Gear Mesh Frequency (GMF), calculated as (Number of Teeth on Gear) x (RPM of that Gear). A healthy gearbox will show a peak at GMF with a few small sidebands.
- Gear Wear: As teeth wear, the amplitude of the GMF peak will increase.
- Cracked/Broken Tooth: A damaged tooth will cause a high-amplitude peak at 1x RPM of that specific gear, and it will generate sideband frequencies around the GMF peak. The spacing of these sidebands will be equal to the running speed of the gear with the bad tooth, pointing the analyst to the exact component.
- Actionable Insight: Gearbox analysis can prevent catastrophic failures that can shut down an entire process. Early detection of GMF sidebands or tooth-repeat frequencies allows for a planned gearbox rebuild or replacement.
Electrical Faults in Motors
Vibration analysis can even detect electrical issues within AC induction motors.
- Vibration Signature: Common electrical faults, such as broken rotor bars or stator issues, often generate vibration at 2x the electrical line frequency (120 Hz in North America, 100 Hz in Europe). You may also see sidebands around the 1x RPM running speed peak, spaced at the Pole Pass Frequency.
- Actionable Insight: When these electrical signatures are detected, it signals the need to involve an electrician to perform more specialized electrical motor testing (such as motor circuit analysis or insulation resistance testing). This is a great example of how different condition monitoring technologies work together. For facilities with many motors, a focused predictive maintenance for motors strategy is essential.
The Operationalization Blueprint: Integrating Vibration Analysis into Your Maintenance Workflow
Having the best diagnostic tools is only half the battle. The real return on investment comes from systematically integrating vibration analysis into your day-to-day operations. This is how you turn data into action.
Step 1: Asset Criticality Analysis - Don't Boil the Ocean
You can't monitor everything. The first step is to determine where to focus your efforts. Perform an asset criticality analysis to rank your equipment based on its impact on the facility. Consider factors like:
- Production Impact: What happens if this machine fails? Does it stop the entire plant or just a single, redundant line?
- Safety/Environmental Impact: Could failure cause a safety hazard or an environmental release?
- Repair Cost/Lead Time: Is the machine expensive to repair? Are spare parts difficult to obtain?
Focus your initial vibration analysis efforts on your most critical assets. You can expand the program later.
Step 2: Building the Asset Database and Setting Baselines
In your analysis software, create a database of all the assets you plan to monitor. For each asset, you need to input key information like motor speed, bearing model numbers, coupling types, and the number of teeth on gears. This data is what the software uses to calculate fault frequencies.
Once the database is built, take initial vibration readings on healthy, well-running machines. This establishes the "baseline" signature. Then, set alarm thresholds. While industry standards like ISO 10816 provide good general guidelines for overall vibration levels, the most effective alarms are statistical, set slightly above the machine's unique baseline. For example, an "Alert" might be triggered at 2x the baseline amplitude, and a "Danger" alarm at 5x the baseline.
Step 3: Establishing Data Collection Routes and Frequencies
Determine how and how often data will be collected.
- Collection Method: For less critical assets, a technician can use a portable analyzer to follow a pre-defined "route" through the plant on a scheduled basis. For your most critical or hard-to-access equipment, install wireless sensors for continuous or near-continuous monitoring.
- Collection Frequency: The frequency depends on the asset's criticality and its P-F interval (the time from when a fault is first detectable to when it results in functional failure). A highly critical asset might be monitored weekly or even daily, while a less critical, stable machine might only be checked quarterly.
Step 4: The Crucial Link - CMMS Integration
This is the step that separates a good program from a great one. A vibration analysis program that operates in a silo is inefficient. The data must flow seamlessly into your core maintenance management system.
A robust computerized maintenance management system (CMMS) acts as the central hub for all maintenance activity. When your vibration analysis platform detects a confirmed fault—for example, a Stage 2 bearing defect—it should automatically trigger an action in the CMMS.
How it works:
- The vibration software issues a "Danger" alarm for a bearing fault on Pump P-101.
- Through a pre-configured API, this alarm automatically creates a new work order in the CMMS.
- The work order is pre-populated with essential information: the asset name (P-101), the diagnosed fault (Inner Race Defect), the severity, and even a recommendation from the analyst (e.g., "Replace motor-end bearing, Part #6205-2RS, within 4 weeks").
- The maintenance planner sees the new work order, schedules the job, and ensures the necessary parts and labor are allocated.
This level of CMMS integration closes the loop between fault detection and corrective action. It eliminates manual data entry, prevents alerts from being forgotten, and builds a comprehensive, searchable maintenance history for every asset, which is invaluable for future analysis and reliability engineering.
Step 5: Reporting and Continuous Improvement
Finally, you must demonstrate the value of the program. Generate regular reports that highlight key metrics:
- "Catches": A list of all the faults identified and corrected before they could cause a failure.
- Cost Avoidance: Quantify the value of these catches. For each one, estimate the cost you avoided in lost production, emergency repair costs, and secondary damage.
- Reliability Metrics: Show improvements in key performance indicators (KPIs) like Mean Time Between Failure (MTBF) and overall equipment effectiveness (OEE).
Use the data collected not just for predictive tasks, but for Root Cause Failure Analysis (RCFA). If you repeatedly see misalignment issues on a certain type of pump, it's a sign that your installation or alignment procedures need to be improved. This is how you move from being predictive to being truly proactive.
Overcoming Common Hurdles in Your Vibration Analysis Journey
Implementing a vibration analysis program is a journey, and there will be challenges. Here’s how to anticipate and overcome them.
The "Data Overload" Problem
- Challenge: With hundreds of wireless sensors sending data every hour, you can quickly find yourself drowning in information that exceeds your team's capacity to analyze it.
- Solution: This is where modern software is essential. Leverage platforms with built-in AI and machine learning. These systems act as a first line of defense, automatically filtering out the "noise" of normal operation and only escalating alerts that represent a statistically significant change. This frees up your human experts to focus on the real problems.
Lack of In-House Expertise
- Challenge: You don't have a certified vibration analyst on staff, and training can be time-consuming and expensive.
- Solution: You have options. You can hire a third-party service provider to manage your program, which is a great way to get started quickly. Alternatively, you can adopt a hybrid approach: use easy-to-interpret wireless sensor systems for initial screening and bring in an expert consultant for complex diagnostics. Over time, you can invest in training and certifying your own team members, building a valuable internal skill set.
Securing Management Buy-In and Proving ROI
- Challenge: The upfront investment in hardware, software, and training can seem daunting to management.
- Solution: Build a strong business case focused on cost avoidance. Don't just talk about vibration frequencies; talk about dollars and cents. Calculate the cost of one hour of downtime for your most critical production line. Then, present a realistic scenario of how many hours of downtime the program could prevent in a year. A simple ROI calculation can be very powerful: (Avoided Downtime Costs + Avoided Emergency Repair Costs) - (Annual Program Cost) = ROI. Frame it as an investment in operational stability and profitability.
The Future is Now: Vibration Analysis in the Age of AI and IIoT
The field of vibration analysis continues to evolve. In 2025, leading organizations are pushing beyond simple prediction.
From Predictive to Prescriptive Maintenance
The next frontier is prescriptive maintenance. While predictive maintenance tells you what will fail and when, prescriptive maintenance tells you why it's failing and what to do about it. A prescriptive maintenance platform integrates data from multiple sources (vibration, oil analysis, thermography, process parameters) and uses AI to not only predict a failure but also to recommend the most effective corrective action to optimize cost, time, and performance.
Holistic Condition Monitoring
Vibration analysis is incredibly powerful, but it's not the only tool. The most advanced reliability programs combine it with other condition monitoring technologies:
- Oil Analysis: To detect chemical breakdown and wear particle contamination in lubricants.
- Infrared Thermography: To spot overheating in electrical components and mechanical systems.
- Ultrasonic Analysis: To detect high-frequency sounds from leaks, electrical arcing, and early-stage bearing faults.
When you combine these data streams, you get a complete, holistic view of asset health, enabling more accurate and confident decision-making.
Conclusion: Your Journey to Proactive Reliability
Vibration analysis is far more than a diagnostic technology; it is a cornerstone of a modern, proactive maintenance strategy. It provides the foresight needed to move away from a reactive, fire-fighting culture and toward a planned, controlled, and optimized operational environment.
The journey begins with understanding the language of vibration—amplitude, frequency, and phase. It is powered by modern hardware and intelligent software. But it only succeeds when it is fully operationalized: integrated with your CMMS, embedded in your workflows, and championed by your people.
By embracing vibration analysis, you are not just preventing failures. You are investing in reliability, extending the life of your assets, improving safety, and building a more resilient and profitable operation for the years to come.
