The Ultimate Guide to Predictive Maintenance Products: Building Your 2025 Solution Stack
Aug 31, 2025
predictive maintenance products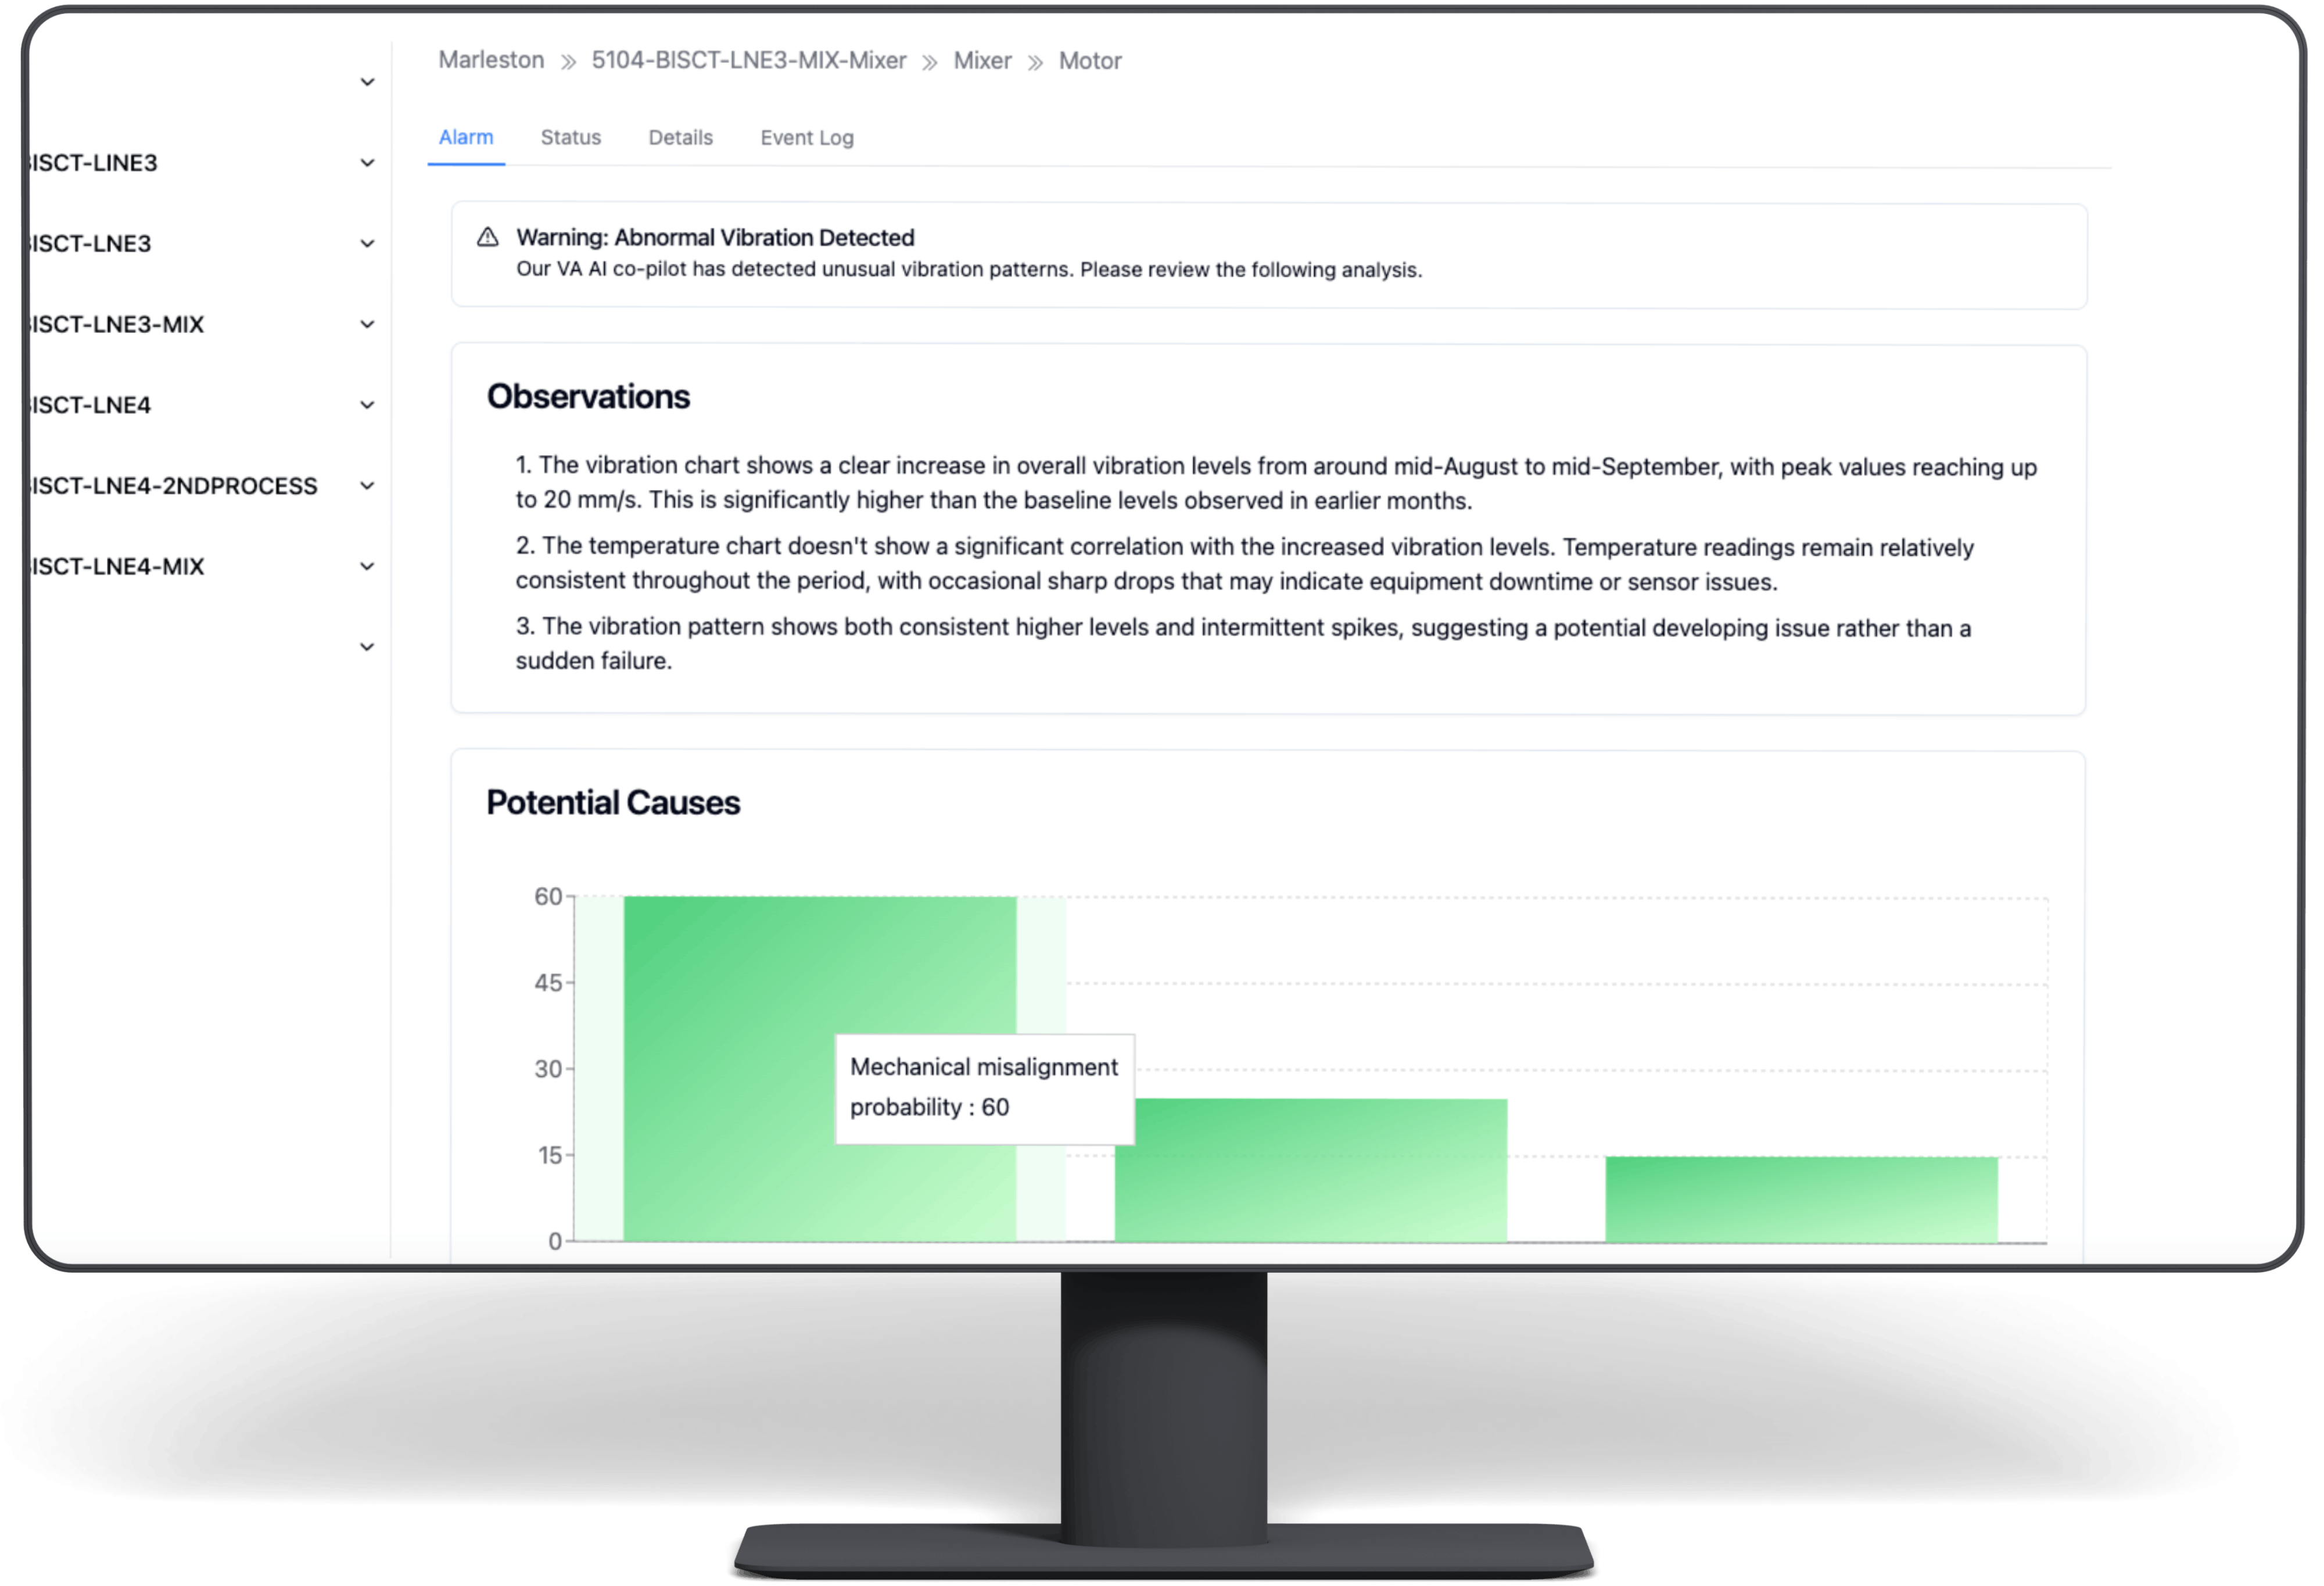
The hum of the factory floor is the sound of money being made. But for a maintenance manager or facility operator, it's also a constant source of anxiety. Every vibration, every temperature spike, every unusual noise could be the prelude to a catastrophic failure—the kind that brings production to a screeching halt, blows budgets, and puts safety at risk. For years, the answer was a cycle of reactive fixes and calendar-based preventive maintenance. But in 2025, that's no longer enough.
You're here because you know there's a better way. You've heard the term "predictive maintenance" and you're ready to move beyond the definition. You're in the commercial investigation phase, looking for the tangible predictive maintenance products that can transform your operations from reactive to predictive, and even prescriptive.
This isn't another list of "top 10 sensors." This is a strategic guide to building your Predictive Maintenance (PdM) Solution Stack. We'll dissect the entire ecosystem—from the sensors on the ground to the AI in the cloud to the work order in your technician's hand. We'll show you how to think like a systems architect, not just a product buyer, to build a resilient, intelligent, and profitable maintenance program for the modern industrial landscape.
Beyond the Hype: Why a Single "Product" is Never Enough
The biggest mistake companies make when adopting PdM is believing a single product is a silver bullet. Buying a set of advanced vibration sensors without a platform to analyze the data is like having a star quarterback with no one to throw the ball to. Conversely, buying sophisticated AI software without clean, reliable data from the right sensors is like having a brilliant coach with no team on the field.
True predictive maintenance success comes from the seamless integration of technology, processes, and people. It's about creating a closed-loop system where data leads to insight, insight leads to action, and action prevents failure.
Condition-Based vs. Predictive: A Crucial Distinction
Before we build our stack, let's clarify a key concept. Many "PdM products" are actually for Condition-Based Monitoring (CBM).
- Condition-Based Monitoring (CBM): This is rule-based and reactive. "IF the vibration on Motor A exceeds threshold X, THEN create an alert." It's a massive step up from running to failure, but it often alerts you when a problem has already begun.
- Predictive Maintenance (PdM): This is forward-looking and proactive. It uses historical data, machine learning, and multiple data streams to forecast future events. "Based on the evolving vibration signature, oil particulates, and thermal profile, Motor A has a 90% probability of bearing failure in the next 350 operating hours."
PdM doesn't just tell you that a machine is unhealthy; it tells you why, what's likely to fail, and when. This level of foresight is what allows you to schedule repairs with surgical precision, optimize labor, and manage inventory just-in-time. To achieve this, you need a complete solution stack.
We can visualize this stack in three core layers:
- Data Acquisition: The hardware that senses the physical world.
- Data Analysis & Insights: The software and algorithms that turn data into intelligence.
- Action & Workflow Management: The systems that translate intelligence into tangible work.
Let's build your stack, layer by layer.
Layer 1: The Data Acquisition Foundation - Your IIoT Sensor Arsenal
This is the foundation of your entire PdM program. The sensors you choose are your eyes and ears on the plant floor, capturing the vital signs of your critical assets. The goal is not to buy the most expensive sensor, but the right sensor for the specific failure modes you need to predict.
Vibration Analysis Sensors: The Cornerstone of Rotating Equipment Health
If you have assets that spin, you need vibration analysis. It is the most established and powerful technology for monitoring the health of motors, pumps, fans, gearboxes, and compressors. Subtle changes in vibration patterns are often the earliest indicators of mechanical wear and tear.
- What They Measure: Acceleration, velocity, and displacement across various frequency spectrums.
- What They Predict:
- Bearing wear and fatigue (the #1 cause of motor failure)
- Shaft imbalance and misalignment
- Gear tooth wear or damage
- Mechanical looseness
- Resonance issues
- Key Selection Criteria:
- Frequency Range (Hz): Low-speed equipment (<300 RPM) needs sensors that can detect low frequencies, while high-speed equipment requires a wider range.
- Sensitivity (mV/g): Higher sensitivity is needed for detecting very subtle faults.
- Connectivity: Wired (4-20mA, Modbus) for critical, fixed assets; Wireless (Bluetooth, Wi-Fi, LoRaWAN) for easier deployment on less critical or hard-to-reach assets.
- Environmental Rating: IP67/68 rating for dusty or wet environments, and intrinsic safety (ATEX/IECEx) for hazardous locations.
- Real-World Example: A critical conveyor motor at a distribution center begins to show a minuscule increase in high-frequency vibration. The PdM algorithm identifies this as the signature of an early-stage outer race bearing fault, predicting a failure in 6-8 weeks. Maintenance is scheduled during a planned shutdown in 4 weeks, preventing an unexpected line stoppage that would have cost $50,000 per hour in lost throughput.
Industrial Thermal Imaging: Seeing Heat, Predicting Failure
Friction, electrical resistance, and mechanical stress all generate heat. Thermal imaging cameras, or pyrometers, translate this infrared energy into a visual image, allowing you to spot anomalies long before they become visible to the naked eye or cause a failure.
- What They Measure: Surface temperature with incredible precision.
- What They Predict:
- Overheating electrical connections in panels and switchgear
- Motor stress due to overload or poor cooling
- Friction from misalignment or poor lubrication in couplings and bearings
- Insulation breakdown in pipes and refractory materials
- Blockages in cooling systems or heat exchangers
- Key Selection Criteria:
- Resolution (Pixels): Higher resolution allows you to detect smaller temperature differences from further away. 640x480 is a professional standard.
- Thermal Sensitivity (NETD): Measured in milliKelvins (mK), this is the smallest temperature difference the camera can detect. A lower number (<50mK) is better.
- Form Factor: Handheld cameras for routine inspections and troubleshooting; fixed-mount cameras for continuous monitoring of highly critical assets (like a transformer or server rack).
- Real-World Example: During a routine monthly scan of electrical cabinets with a handheld thermal camera, a technician notices a lug connection that is 40°C hotter than identical adjacent connections. This indicates high resistance due to a loose or corroded connection. Tightening the lug takes 15 minutes and costs nothing in parts, preventing a potential arc flash event and a plant-wide power outage.
Acoustic Monitoring Sensors: Listening for Trouble
Some failures whisper before they shout. Acoustic sensors, particularly those operating in the ultrasonic range (above 20 kHz), can detect high-frequency sounds generated by friction, turbulence, and electrical discharges that are inaudible to the human ear.
- What They Measure: Sound pressure waves (both airborne and structure-borne).
- What They Predict:
- Compressed air and gas leaks (a major source of wasted energy)
- Electrical arcing, tracking, and corona in high-voltage equipment
- Early-stage bearing faults (can detect lack of lubrication even before vibration increases)
- Valve and steam trap leakage
- Key Selection Criteria:
- Frequency Range (kHz): Must be able to capture the specific ultrasonic frequencies of the target failure mode (e.g., 20-100 kHz).
- Heterodyning Capability: The ability to translate inaudible ultrasonic signals into an audible range for human analysis.
- Type: Airborne sensors for leak detection; structure-borne sensors that make direct contact with the asset for mechanical fault detection.
- Real-World Example: A fixed acoustic sensor on a large industrial air compressor system detects a persistent, high-frequency hissing sound signature. The PdM platform pinpoints the sound's location to a specific section of the distribution line. A technician investigates and finds a tiny, invisible fracture in a pipe fitting, a leak that was costing the facility over $15,000 per year in wasted energy.
Oil Analysis Equipment: The Blood Test for Your Machinery
The oil and other fluids in your machinery are like its bloodstream. Analyzing the condition and composition of this fluid provides a wealth of information about the health of the internal components.
- What They Measure: Particle count and shape, viscosity, water content, chemical composition, and oxidation levels.
- What They Predict:
- Accelerated wear of specific components (e.g., high copper indicates bushing wear, high iron indicates gear wear).
- Contamination from water, coolant, or other fluids.
- Incorrect lubricant being used.
- Oil degradation, indicating it's no longer providing adequate protection.
- Key Selection Criteria:
- On-site vs. Lab: On-site sensors (inline or portable) provide real-time data on key parameters like particle count and water content. Full laboratory analysis provides a much more detailed spectrometric breakdown but has a longer lead time. A hybrid approach is often best.
- Parameters Monitored: Ensure the chosen sensor or lab service can detect the specific metals and contaminants relevant to your machinery.
- Real-World Example: An on-site oil particle counter on a critical gearbox shows a sudden spike in ferrous particles. The alert triggers a full lab sample to be taken. The lab report confirms the presence of large, angular steel particles, indicative of a cracking gear tooth. The gearbox is scheduled for an overhaul, preventing a catastrophic failure that would have shattered the entire gear set, sent shrapnel through the system, and caused months of downtime waiting for a replacement.
Motor Circuit Analysis (MCA) & Electrical Signature Analysis (ESA)
While vibration and thermal analysis look at the mechanical symptoms of a motor's health, MCA and ESA look directly at its electrical health—the equivalent of an EKG for your motors.
- What They Measure: Resistance, inductance, impedance, phase balance, and subtle distortions in the current and voltage waveforms.
- What They Predict:
- Stator winding faults (turn-to-turn, coil-to-coil, phase-to-phase)
- Rotor bar degradation or cracks
- Insulation breakdown (ground faults)
- Power quality issues (voltage imbalance)
- Air gap eccentricities
- Key Selection Criteria:
- Test Type: De-energized (MCA) tools are used when the motor is offline and provide a deep diagnostic of the circuit's integrity. Energized (ESA) tools are used while the motor is running and are excellent for detecting rotor issues and power quality problems.
- Real-World Example: An ESA is performed on a critical centrifugal pump motor. The analysis software detects sidebands around the line frequency, a classic signature of broken rotor bars. This condition reduces the motor's efficiency and, if left unchecked, can lead to catastrophic rotor failure. The motor is scheduled for replacement at the next opportunity, improving energy efficiency and preventing a sudden, costly failure.
Layer 2: Data Analysis & Insights - The Brains of the Operation
Collecting terabytes of sensor data is useless if you can't turn it into clear, actionable intelligence. This layer is where raw measurements become failure predictions and operational recommendations. It's the bridge between your hardware and your maintenance team.
The Core Platform: From CMMS to Asset Performance Management (APM)
Your Computerized Maintenance Management System (CMMS) is the heart of your maintenance world. It holds your asset registry, work order history, and PM schedules. A modern, robust CMMS software is the foundational system of record. However, to execute true PdM, this platform must evolve.
This is where Asset Performance Management (APM) comes in. APM is a strategy and a software category that sits on top of or integrates deeply with your CMMS. An APM platform's job is to:
- Ingest and Aggregate Data: Pull in data from all your different PdM products—vibration, thermal, acoustic, oil, etc.—into one centralized location.
- Contextualize Data: Link the incoming sensor data to the specific asset in your CMMS hierarchy. A vibration reading is meaningless without knowing it came from "Motor-101" which drives "Pump-A" on "Production-Line-3."
- Visualize and Analyze: Provide dashboards, trending charts, and analytical tools that allow reliability engineers to explore the data and understand asset health at a glance.
When choosing a platform, look for one with open APIs and integrations that can connect to a wide variety of sensor hardware and enterprise systems.
The Power of Predictive Maintenance Algorithms
This is the "magic" of PdM, but it's not magic—it's math. Predictive algorithms are what analyze the data from your APM platform to detect subtle patterns and forecast failures. Understanding the types of algorithms helps you ask the right questions of vendors.
- Physics-based Models: These use known engineering formulas and principles. For example, a model might use a bearing's load, speed, and material properties (its L10 life rating) combined with real-world operating temperatures to calculate a more accurate expected lifespan.
- Statistical Models: These models, like Weibull Analysis, look at the failure history of a population of similar assets to determine the probability of failure over time. They are great for components but don't always account for specific operating conditions.
- Machine Learning (ML) Models: This is the gold standard for modern PdM and the core of any true AI predictive maintenance solution.
- Anomaly Detection: The simplest form. The ML model learns what "normal" operation looks like by analyzing baseline data (vibration, temperature, current draw, etc.). It then flags any deviation from this multi-variate baseline as a potential issue, often long before any single threshold is breached.
- Supervised Learning (Classification/Regression): You "supervise" the model by feeding it labeled historical data. For example, you provide thousands of vibration signatures that you've labeled as "Healthy," "Minor Bearing Wear," or "Imminent Failure." The model learns to classify new, incoming data into these categories. Regression models can predict a continuous value, like Remaining Useful Life (RUL).
- Remaining Useful Life (RUL) Estimation: This is the holy grail of PdM. RUL models analyze the rate of degradation and project forward to estimate how much longer an asset can run before it requires maintenance. This is what enables true just-in-time repairs.
The success of any ML model is critically dependent on the quality and quantity of your historical data. This is why having a well-maintained CMMS with years of detailed work order and failure history is an invaluable asset.
The Rise of Prescriptive Maintenance: Beyond Prediction to Recommendation
By 2025, the leading edge is moving beyond prediction to prescription. This is the next logical evolution, closing the gap between insight and action completely.
- Predictive: "Pump A will fail in 10 days due to bearing degradation."
- Prescriptive: "Pump A will fail in 10 days due to bearing degradation. To prevent this, a high-priority work order has been created for Technician B (who has the right skills). Part #XYZ-123 has been reserved from inventory, and PM Procedure #456 is attached with detailed instructions. The estimated repair time is 4 hours. Would you like to approve and schedule?"
A prescriptive maintenance engine integrates the PdM analysis with the operational logistics of your CMMS—technician skills and availability, inventory levels, and standard operating procedures—to recommend a complete, optimized solution.
Layer 3: Action & Workflow Management - Closing the Loop
All the advanced sensors and brilliant algorithms in the world are worthless if the insights they generate sit in a dashboard unread. The final, and arguably most important, layer of the stack is the one that ensures predictions are turned into completed work.
Automated Work Order Generation: From Alert to Action in Seconds
Manual intervention is a bottleneck. A modern PdM workflow should be automated. When the PdM platform issues a high-confidence failure prediction, it should use an API to automatically trigger a work order in your CMMS.
This work order shouldn't be generic. It should be pre-populated with:
- The asset ID and location.
- The nature of the predicted failure (e.g., "Predicted outer race bearing fault").
- A link to the supporting data (the vibration trend, the thermal image).
- The recommended corrective action.
- A priority level based on the RUL estimate.
This automation reduces response time from hours or days to mere seconds, ensuring that critical alerts are never missed.
Integrating with Inventory and Spares Management
A key benefit of PdM is optimizing MRO (Maintenance, Repair, and Operations) inventory. Carrying too many spares ties up capital, while carrying too few leads to extended downtime. PdM allows for a more intelligent, just-in-time approach.
When a PdM-generated work order is created, the system should automatically query your inventory management module.
- If the part is in stock: It can be reserved for that specific job.
- If the part is not in stock: It can automatically trigger a purchase requisition.
Because PdM gives you weeks or months of lead time, you can often order parts with standard shipping instead of expensive overnight freight, generating significant cost savings.
The Human Element: Empowering Technicians with Mobile Tools
Your technicians are the ones who ultimately execute the work. They need to be empowered with the right information at the right time. A mobile CMMS is no longer a luxury; it's a necessity.
Imagine a technician receiving an alert on their tablet. They can:
- View the work order and its priority.
- Access the asset's complete history, including past repairs and failures.
- Review the specific sensor data that triggered the alert, seeing the trend lines for themselves.
- Pull up digital manuals, schematics, and standard operating procedures.
- Log their work, record parts used, and close out the job from the field.
This provides a closed feedback loop. The technician's notes on what they found ("Confirmed advanced spalling on bearing outer race") become valuable data for refining the AI models in the future.
Building Your PdM Stack: A Practical 5-Step Implementation Guide
This may seem complex, but you don't have to implement everything at once. A phased, strategic approach is the key to success and building momentum.
Step 1: Launch a Pilot Program. Don't try to boil the ocean. Select a small group of 5-10 assets that are both highly critical and historically problematic. This limits your initial investment and provides a clear test case.
Step 2: Define Failure Modes. For your pilot assets, perform a Failure Mode and Effects Analysis (FMEA). This structured process helps you identify all the ways an asset can fail and the effects of that failure. As noted by experts at Reliabilityweb, this analysis is fundamental to any reliability effort. The identified failure modes will directly inform which sensor technologies you need.
Step 3: Select and Install Your Technology. Based on your FMEA, choose the right sensors and a platform that can support them. For example, if bearing wear and misalignment are your primary failure modes for a pump, a triaxial vibration sensor is a must. Ensure proper installation—a poorly mounted sensor will give you garbage data.
Step 4: Establish Baselines and Train Models. Don't expect accurate predictions on day one. You need to collect data for a period (a few weeks to a few months) to establish a comprehensive baseline of what "normal" operation looks like under various conditions (e.g., different loads, speeds, ambient temperatures). This baseline data is used to train your anomaly detection models.
Step 5: Integrate, Iterate, and Scale. Connect your PdM platform to your CMMS to automate workflows. Carefully track the results of your pilot. Did you catch a failure? Calculate the ROI (see below). Use this success story—"We invested $15,000 in this pilot and avoided a $100,000 failure"—to gain executive buy-in and secure funding to scale the program to the next group of critical assets. As the NIST framework for smart manufacturing highlights, this iterative, scalable approach is key to digital transformation.
Calculating the ROI of Predictive Maintenance Products
Ultimately, any investment in predictive maintenance products must be justified by its return. The formula is simple, but gathering the data is key.
ROI = (Downtime Cost Avoided + Maintenance Cost Savings - PdM Solution Cost) / PdM Solution Cost
- Downtime Cost Avoided: This is your biggest value driver. Calculate your cost of downtime per hour (lost production revenue + idle labor + scrap). Multiply this by the number of downtime hours you avoided thanks to PdM.
- Maintenance Cost Savings:
- Reduced PMs: Cost of labor and materials for preventive tasks you no longer need to do.
- Reduced Overtime: Cost savings from scheduling repairs during normal hours instead of emergency call-outs.
- Optimized Inventory: Reduced carrying costs for spares.
- Reduced Secondary Damage: Cost of avoiding a catastrophic failure that damages other components.
- PdM Solution Cost:
- Hardware: Sensors, gateways, etc.
- Software: Subscription fees for your APM/CMMS platform.
- Implementation: Installation, training, and configuration costs.
By diligently tracking these metrics, you can clearly demonstrate the immense financial value of your PdM program and justify its continued expansion.
The Future is a Connected Stack
Investing in "predictive maintenance products" in 2025 is about more than buying hardware. It's about architecting an intelligent, interconnected ecosystem—a full solution stack. It starts with the right sensors acquiring clean data, flows into a powerful software brain that provides foresight, and results in precise, automated actions that are managed and tracked in your CMMS.
This journey transforms your maintenance department from a cost center into a strategic driver of profitability and reliability. By starting smart, proving value, and scaling intelligently, you can leave the era of reactive firefighting behind and become the architect of a truly predictive, resilient, and future-proof operation.
