The Ultimate 2025 Guide to Signs of Impending Equipment Failure
Aug 13, 2025
Equipment Failure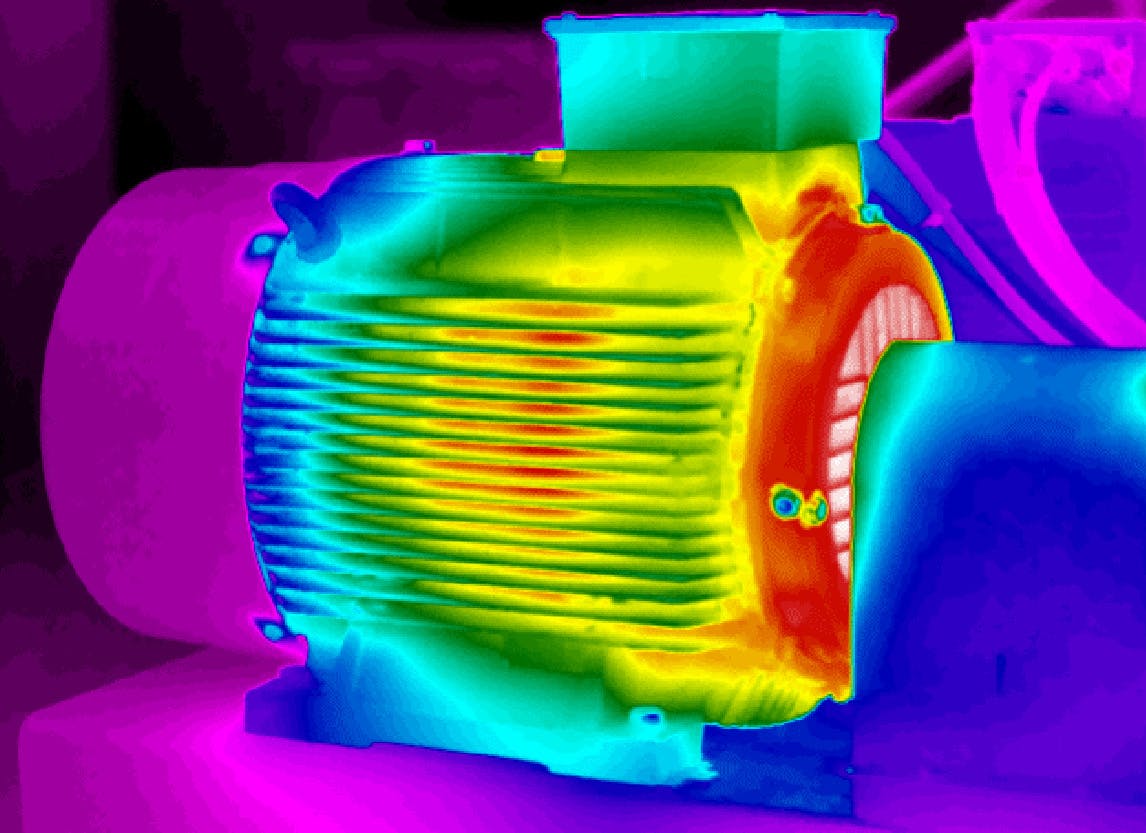
Unplanned downtime. It’s the phrase that sends a shiver down the spine of any maintenance manager, plant supervisor, or operations executive. In today's hyper-competitive industrial landscape, an unexpected equipment failure isn't just an inconvenience; it's a cascade of negative consequences. It means lost production, missed deadlines, frustrated customers, spiraling overtime costs, and potential safety hazards. The average manufacturing plant loses an estimated 5% to 20% of its productive capacity due to downtime, a staggering figure that directly impacts the bottom line.
For decades, the approach was reactive: wait for something to break, then scramble to fix it. But in 2025, that model is obsolete. The key to operational excellence isn't just fixing things fast; it's preventing them from breaking in the first place. This requires a fundamental shift in mindset and methodology—from reactive to predictive. It means learning to listen to your equipment, understanding its language, and recognizing the subtle (and not-so-subtle) signs of impending equipment failure long before a catastrophic event occurs.
This guide is your comprehensive roadmap. We'll move beyond a simple checklist and delve into the science and strategy of failure detection. We'll explore everything from foundational human senses to the most advanced AI-driven analytics, providing you with the actionable insights needed to build a resilient, proactive, and highly efficient maintenance program.
Beyond the Obvious: Understanding the P-F Curve in 2025
To truly master failure detection, you must first understand the lifecycle of a fault. The most powerful tool for this is the P-F Curve. It’s a cornerstone concept in reliability-centered maintenance that charts the health of an asset over time.
What is the P-F Curve?
The P-F Curve illustrates the journey of a piece of equipment from a state of perfect health to complete functional failure.
- P (Potential Failure): This is the point in time when a potential failure becomes detectable. It's the earliest warning sign, often subtle and only identifiable with specific condition monitoring technologies. For example, an ultrasonic sensor might detect a specific high-frequency sound indicating a lack of lubrication in a bearing. The bearing is still functioning, but a failure process has begun.
- F (Functional Failure): This is the point where the equipment can no longer perform its intended function to the required standard. The bearing has seized, the motor has burned out, the pump has stopped moving fluid.
The interval between point P and point F is your window of opportunity. The earlier you can detect the potential failure (the further left you are on the curve), the more time you have to plan, schedule, and execute a repair with minimal disruption and cost. Reacting at point F is always the most expensive and disruptive option.
Why a 2025 Perspective Matters: The Impact of IIoT and AI
Historically, point P was defined by what a skilled technician could see, hear, or feel. In 2025, the game has changed. The Industrial Internet of Things (IIoT) has blanketed our facilities with affordable, powerful sensors collecting vast amounts of data—vibration, temperature, current, pressure, acoustics, and more.
This data, when harnessed by Artificial Intelligence (AI) and machine learning algorithms, pushes point P significantly further to the left. AI can detect minuscule deviations and complex patterns in data that are completely invisible to human senses or traditional analysis. It can identify a potential bearing failure weeks or even months before it would create audible noise or measurable heat, transforming the P-F interval from days to months. This is the core of modern AI-powered predictive maintenance, which moves maintenance from a reactive or even preventive schedule to a truly condition-based, predictive reality.
Mapping Detection Methods to the P-F Curve
Different detection methods catch failures at different stages along the P-F Curve.
- Furthest from Failure (Earliest Detection): AI-driven anomaly detection, ultrasonic analysis, oil analysis.
- Mid-Curve: Vibration analysis, thermography.
- Closest to Failure (Latest Detection): Human senses (audible noise, visible smoke, high heat).
A world-class maintenance program uses a combination of these techniques, layering them to create a comprehensive safety net.
The Foundational Layer: Sensory and Observational Signs
Before you invest in a single sensor, you must master the most fundamental and cost-effective tools you have: the senses of your own team. Empowering operators and technicians to be the first line of defense is a critical, and often overlooked, step. These are the signs that typically appear further down the P-F curve, but they are crucial for preventing imminent breakdowns.
The Power of Sight: Visual Clues You Can't Ignore
Daily walk-arounds and operator inspections are not just about ticking a box. They are data collection opportunities. Train your team to look for:
- Leaks: Oil, coolant, or other fluid leaks are clear indicators of a failing seal, gasket, or hose. Note the color and location of the leak. Is it a slow drip or a steady stream?
- Cracks, Fractures, and Bending: Stress fractures on frames, mounts, or housings are serious red flags. Look for hairline cracks, especially around welds and load-bearing points.
- Corrosion and Discoloration: Rust indicates moisture intrusion and material degradation. Discoloration or "bluing" on metal parts is a classic sign of extreme overheating.
- Loose Fasteners: Vibration can cause bolts, nuts, and screws to loosen over time. A missing or loose fastener can lead to misalignment and catastrophic failure.
- Fraying or Worn Belts: Look for cracks, glazing (a shiny surface), or material loss on drive belts.
- Debris: An unusual accumulation of metal shavings, dust, or rubber particles around a machine often points directly to a wearing component.
Listening for Trouble: Auditory Signatures of Failure
Changes in the sound a machine makes are one of the most common indicators of a problem. A healthy machine has a consistent, rhythmic sound. Any deviation is a signal.
- Grinding: A harsh, abrasive sound, often associated with failing bearings, gears, or inadequate lubrication. It suggests two metal surfaces are making destructive contact.
- Squealing: A high-pitched noise, commonly caused by loose or worn belts, but can also indicate bearing issues.
- Knocking or Banging: A repetitive, low-frequency impact sound. This could be a sign of a loose component (like a piston or crank arm) or severe misalignment.
- Rattling: Suggests something is loose, like a guard, fastener, or internal component.
- Changes in Pitch or Volume: A motor that suddenly starts running louder or at a higher pitch may be under strain or experiencing an electrical issue.
The Sense of Touch (and Temperature): Feeling for Heat and Vibration
Caution: Always use appropriate safety procedures and PPE before touching equipment. Use the back of your hand to briefly check for heat, and never touch rotating parts.
- Excessive Heat: While some heat is normal, a component that is unusually hot to the touch is a major warning sign. This is often the first palpable sign of friction from poor lubrication, overloading, or electrical resistance. An infrared thermometer is a safe and precise way to quantify this.
- Abnormal Vibration: All machines vibrate, but an increase in vibration or a change in its pattern is a clear sign of trouble. It can be caused by imbalance (a fan with a buildup of dirt), misalignment (improperly coupled motors and pumps), worn gears, or failing bearings. While a trained hand can feel significant changes, specialized equipment is needed for early detection.
The Unmistakable Smell of Failure
Our sense of smell can be a powerful diagnostic tool. Certain failures produce distinct odors.
- Burning Smells: The acrid smell of burning plastic or rubber can indicate an overheating motor, failing insulation on wiring, or a slipping belt.
- Ozone Smell: A sharp, metallic smell near electric motors can indicate electrical arcing, a serious issue that can lead to motor failure and fire.
- Chemical Odors: The smell of leaking process fluids or hydraulic oil can help pinpoint a leak before it becomes visible.
Actionable Tip: Don't rely on memory. Standardize these sensory checks. Create detailed inspection checklists for each critical asset and integrate them into your workflow. Using digital tools to manage preventive maintenance procedures ensures that every operator is checking the same things, in the same way, every single time. This creates a consistent, high-quality stream of observational data.
Level Up: Condition-Based Monitoring (CBM) Techniques
While human senses are vital, they typically only catch problems that are relatively close to functional failure. To push detection further up the P-F curve, you need to augment your team's abilities with technology. Condition-Based Monitoring (CBM) uses specialized tools to measure the real-time condition of equipment.
Vibration Analysis: The Heartbeat of Your Machinery
Vibration analysis is arguably the most powerful CBM technology for rotating equipment like motors, pumps, fans, and gearboxes. It's like an EKG for your machines. A sensor (accelerometer) is placed on the equipment, and it measures vibration across a wide spectrum of frequencies.
- What it Detects: Imbalance, misalignment, bearing wear, gear tooth damage, looseness, and resonance issues.
- How it Works: Sophisticated software performs a Fast Fourier Transform (FFT) on the raw vibration signal, breaking it down into its individual frequencies. Specific frequencies correspond to specific fault types. For example, a peak at 1x the running speed often indicates imbalance, while specific higher frequencies can be matched to the unique geometry of a bearing to pinpoint inner race, outer race, or ball defects.
- Key Metrics:
- Overall Vibration (RMS): A general indicator of machine health. A rising trend is a clear warning.
- Spectral Analysis (FFT): The detailed view that allows for root cause diagnosis.
- Waveform Analysis: Looking at the raw vibration signal over time to identify impacting events.
For a deeper dive into standards, the American Society of Mechanical Engineers (ASME) provides a wealth of resources on machinery vibration and monitoring standards.
Thermography: Seeing Heat to Prevent Catastrophe
Infrared (IR) thermography creates a visual image of heat. It's a non-contact, non-destructive technology that can instantly identify abnormal thermal signatures.
- What it Detects:
- Electrical Systems: Loose connections, overloaded circuits, failing breakers, and imbalanced loads all generate heat before they fail. An IR scan of an electrical panel can prevent a fire.
- Mechanical Systems: Overheating in motors, bearings, and gearboxes due to friction or misalignment.
- Process Systems: Blockages in pipes, tank levels, and refractory (insulation) degradation.
- How to Interpret: It's not just about finding a "hot spot." It's about context. You need to compare temperatures of similar components under similar loads. A motor running 20°C hotter than an identical motor next to it is a problem. A three-phase electrical connection where one phase is significantly hotter than the other two indicates a serious issue.
Oil Analysis: The Blood Test for Your Equipment
For any equipment with a lubricating or hydraulic system, oil analysis is like a blood test for a human. A small sample of oil is sent to a lab (or analyzed on-site with modern equipment) to reveal a tremendous amount about the internal health of the machine.
- What it Detects:
- Wear Particles: Microscopic metal particles indicate which components are wearing. Spectrometry can identify the specific metal (iron from gears, copper from bushings, etc.) to pinpoint the problem's location.
- Contamination: The presence of water, coolant, dirt, or other fluids indicates a seal failure or external contamination. Water is especially destructive, promoting corrosion and reducing lubricating properties.
- Oil Condition: Is the oil itself still good? The analysis checks its viscosity (thickness), acidity (TAN), and the depletion of critical additives. This tells you if your oil change intervals are correct.
Ultrasonic Testing: Hearing Beyond Human Limits
Ultrasonics listens for high-frequency sounds (typically > 20 kHz) that are well beyond the range of human hearing. These sounds are often the very first sign of a potential failure.
- What it Detects:
- Early Bearing Failure: Before a bearing starts to vibrate or heat up, the microscopic flaws and lack of lubrication create high-frequency friction. Ultrasonics can detect this weeks or months before other methods.
- Compressed Air/Gas Leaks: Leaking compressed air creates turbulence that generates a distinct ultrasonic hiss. Finding and fixing these leaks can save thousands in energy costs.
- Electrical Faults: Arcing, tracking, and corona in high-voltage electrical equipment produce ultrasound. This is a critical safety inspection tool.
Real-World Example: A large bottling plant relied on a critical syrup pump that could not fail during production. Routine vibration analysis showed a slight increase in a specific high-frequency band. While overall vibration was still within acceptable limits, the trend was concerning. An ultrasonic check confirmed a "hissing" sound indicative of early-stage bearing wear. A work order was created, and the bearing was replaced during the next scheduled maintenance window. The old bearing showed clear signs of initial pitting. The CBM data prevented an in-service failure that would have halted the entire bottling line for hours, saving an estimated $50,000 in lost production.
The Apex of Prevention: AI-Powered Predictive and Prescriptive Maintenance
Condition-based monitoring is powerful, but it often requires a human expert to interpret the data and decide on a course of action. The next evolution, powered by AI, automates and enhances this process, creating a truly forward-looking maintenance strategy.
How AI Changes the Game: From "What" to "When" and "Why"
AI models, specifically machine learning, can analyze multiple streams of sensor data (vibration, temperature, current, pressure, etc.) simultaneously. They learn the unique operational "fingerprint" of a healthy asset. Once this baseline is established, the AI can detect even the most subtle deviations that signal the start of a failure mode.
This moves beyond CBM's "what is happening now" to predictive maintenance's (PdM) "what will happen, and when." It can provide a Remaining Useful Life (RUL) estimate, such as: "Bearing 7B has a 90% probability of failure within the next 450 operating hours." This allows for truly optimized maintenance planning.
Predictive Analytics (PdM): Using Sensor Data to Forecast Failure
Predictive maintenance isn't a single technology; it's a strategy built on data.
- Data Collection: IIoT sensors gather high-frequency data from critical assets.
- Data Transmission: Data is sent to a central platform, either on-premise or in the cloud.
- Data Analysis: Machine learning algorithms analyze the data for anomalies, patterns, and trends.
- Alert Generation: When the system predicts a failure, it automatically generates an alert or a work order with detailed diagnostic information.
Prescriptive Maintenance (RxM): The Future is Now
If PdM tells you when something will fail, prescriptive maintenance (RxM) tells you why it's failing and what you should do about it. It's the ultimate evolution of maintenance strategy.
RxM systems integrate machine data with operational data (e.g., production schedules, load, speed) and maintenance records from a CMMS. This allows them to provide not just a prediction, but a recommended course of action to mitigate or delay the failure.
- Predictive Alert: "Motor 3 is predicted to fail in 2 weeks due to bearing wear."
- Prescriptive Recommendation: "Motor 3 is predicted to fail in 2 weeks due to bearing wear, accelerated by recent high-load operations. Recommendation: Reduce operating speed by 15% to extend life by an additional 3 weeks, allowing replacement to be scheduled during the planned facility-wide shutdown. Order part number 55-XYZ from inventory."
This level of intelligence empowers teams to make optimal decisions that balance production needs with asset health, maximizing both uptime and efficiency.
Building a Robust Failure Detection Program: A Step-by-Step Guide
Recognizing the signs is one thing; building a systematic program to act on them is another. Here’s how to structure your approach for maximum impact.
Step 1: Asset Criticality Analysis (ACA)
You can't monitor everything. An ACA helps you prioritize. Rank your assets based on their impact on safety, production, and repair cost if they were to fail. A high-criticality asset (e.g., the main plant air compressor) warrants more intensive monitoring than a low-criticality asset (e.g., an office HVAC unit).
Step 2: Failure Mode and Effects Analysis (FMEA)
For your most critical assets, conduct an FMEA. This structured process involves identifying all the potential ways an asset can fail (failure modes), the effects of that failure, and its potential causes. A great resource for this is the Reliability Analysis Center, which offers detailed guides. This analysis tells you what you should be looking for. If a common failure mode is bearing seizure due to lubrication loss, then oil analysis and ultrasonic testing should be your primary detection methods.
Step 3: Selecting the Right Detection Technologies for Each Asset
Using your ACA and FMEA, map the best detection technologies to each critical asset.
- Main Air Compressor (High Criticality): Use a full suite—online vibration and temperature sensors, regular oil analysis, and ultrasonic checks for air leaks.
- HVAC Blower Fan (Medium Criticality): Use periodic, route-based vibration analysis and thermography scans.
- Small Conveyor Motor (Low Criticality): Rely on operator sensory inspections and basic preventive maintenance tasks.
Step 4: Integrating Data into a Centralized System
Your data is useless if it lives in isolated silos. All information—from operator inspection notes to vibration data to oil lab results—needs to be funneled into a central hub. A modern CMMS Software acts as this central nervous system. When a CBM system detects an anomaly, it should automatically trigger a work order in the CMMS, complete with all the relevant data, asset history, and required spare parts. This seamless integration turns insight into action.
Step 5: Training and Empowering Your Team
Technology is only a tool. The success of your program depends on your people.
- Operators: Train them on what to look, listen, and feel for. Give them the time and tools (like mobile CMMS apps) to report findings easily.
- Technicians: Invest in CBM technology training and certification. Empower them to not just collect data, but to analyze it and make recommendations.
- Engineers & Managers: Ensure they understand how to use the data to make strategic decisions about scheduling, budgeting, and asset lifecycle management.
Overcoming Common Hurdles in Implementation
Transitioning to a proactive model is a journey with potential challenges.
- The Data Challenge: AI and CBM require clean, consistent data. Start by ensuring your asset hierarchy and maintenance records are accurate in your CMMS. When deploying sensors, ensure they are installed correctly to provide reliable data.
- The Culture Shift: Moving from a "firefighting" culture to a proactive one requires buy-in from everyone. Communicate the "why" behind the change. Celebrate proactive "saves" just as much as heroic reactive repairs. Show how the new approach makes everyone's job safer and less stressful.
- The Cost Justification: CBM and AI technologies have a cost. To get management approval, build a business case focused on ROI. Calculate the cost of downtime for a critical asset (lost production, labor, etc.) and show how a predictive system, even by preventing one or two failures a year, can provide a payback in months, not years.
Your Future is Proactive
The signs of impending equipment failure are all around you. They range from the groan of a struggling motor to the subtle patterns hidden within megabytes of sensor data. In 2025, the most successful industrial operations will be those that master the art and science of listening to these signs.
By embracing a multi-layered approach—combining the invaluable intuition of your experienced team with the powerful precision of CBM and AI—you can move up the P-F curve. You can transform your maintenance department from a cost center focused on repair to a strategic advantage focused on reliability. Stop waiting for failure. Start predicting it, preventing it, and paving the way for a new era of operational excellence.
