The Language of Machines: A Definitive Guide to Vibration Analysis
May 27, 2025
Predictive Maintenance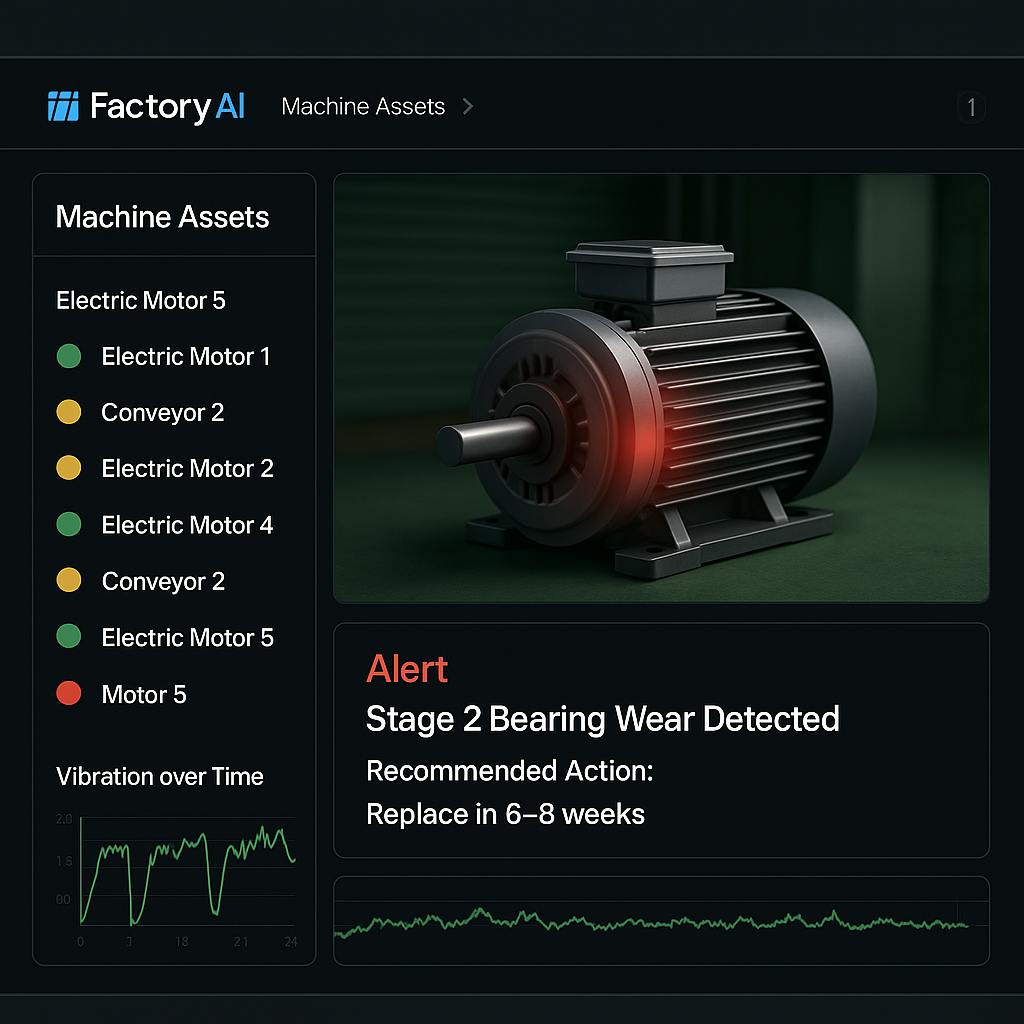
Every piece of rotating equipment in your facility is having a constant conversation. Your pumps, motors, compressors, and gearboxes are continuously speaking a complex, hidden language—a language of vibration. When they are healthy, they hum a steady, consistent tune. But when a problem begins to develop, their tone changes. They start to whisper about impending failure long before they begin to smoke, screech, or grind to a halt.
For decades, the only people who could understand this language were highly trained specialists, the elite translators of machinery health. They were the masters of vibration analysis.
But the world is changing. A dual revolution—in both data collection and data analysis—is breaking down this language barrier. The rise of advanced wireless sensors and the power of artificial intelligence are democratizing this powerful knowledge, placing it in the hands of everyday maintenance and reliability teams.
This is the definitive guide to vibration analysis for the modern industrial era. We will journey from the fundamental physics of vibration to the intricate art of traditional spectrum analysis. We will explore the classic signatures of the most common machine faults. But most importantly, we will reveal how the combination of modern IoT sensors and powerful AI is becoming the universal translator, turning complex vibrational data into clear, actionable, and predictive insights that can save your facility from catastrophic downtime.
Part 1: The Fundamentals - Why Machines Vibrate and How We Measure It
At its core, vibration analysis is the process of measuring the vibration signals from a piece of machinery, analyzing them, and using that information to determine the machine's health and identify specific developing faults. It is the cornerstone of any effective predictive maintenance (PdM) program.
All rotating equipment vibrates. This motion is a natural byproduct of the forces at play—imbalances, friction, and the interaction of components like bearings and gears. Our goal is to listen to this vibration, establish a "baseline" of what's normal, and then detect any deviation from that baseline, which indicates a change in the machine's condition.
Vibration is measured in three key parameters, each telling a different part of the story:
- Displacement (Measured in mils or microns): This tells us how far a machine component is moving back and forth. Displacement is most useful for analyzing very low-frequency vibrations, typically below 10 Hz. Think of it as observing the slow, heavy wobble of a poorly balanced ceiling fan. It's excellent for detecting imbalance in low-speed machinery.
- Velocity (Measured in inches/sec or mm/sec): This tells us how fast the machine is moving. Velocity is the most common and versatile parameter, providing the best overall view of machine health across a mid-range of frequencies (typically 10 to 1,000 Hz). It is directly related to the destructive energy of the vibration; a high velocity reading indicates a problem that is likely causing wear and tear.
- Acceleration (Measured in Gs; 1 G = force of gravity): This tells us how quickly the machine is changing speed as it oscillates. Acceleration is highly sensitive to high-frequency events, making it the best parameter for detecting the earliest signs of bearing wear, gear mesh issues, and lubrication problems, which often generate high-frequency ticking and ringing sounds.
Key Takeaway: You use displacement for low-speed issues, velocity for overall health, and acceleration to find the earliest warnings of high-frequency faults like bearing and gear problems.
Part 2: The Evolution of Data Collection: From Walk-Around to Wireless
The power of vibration analysis is entirely dependent on the quality and frequency of the data you collect. For decades, the process was manual, laborious, and infrequent. Today, it is becoming automated, continuous, and infinitely more powerful.

The "Old Way": Walk-Around Data Collection
The traditional method involved a maintenance technician or reliability engineer physically walking a pre-defined route through the facility with a handheld data collector. This portable device would be connected via a cable to a magnetic-base accelerometer. At each machine, the technician would:
- Find the pre-marked measurement points on the asset.
- Mount the magnetic sensor firmly in place.
- Wait for the reading to stabilize and press a button to record the data.
- Repeat this for multiple points on each machine (e.g., motor inboard bearing, motor outboard bearing, pump inboard, pump outboard).
- At the end of the day, return to their office and upload the collected data to a PC for analysis.
This "walk-around" method was revolutionary in its time, but it has significant drawbacks:
- Infrequent: These routes were often performed only once a month or once a quarter. A fault could easily develop and progress to failure in the long gap between readings.
- Inconsistent: Data quality depended heavily on the technician's skill in placing the sensor on the exact same spot with the same pressure every single time.
- Unsafe: It required technicians to get physically close to running machinery, often in hazardous or hard-to-reach locations.
- Data Silos: The data lived on a local PC, making it difficult to share or correlate with other plant systems.
The "New Way": Wireless IoT Sensors and Continuous Monitoring
The game-changer has been the development of rugged, affordable, and highly capable wireless IoT sensors. These are typically small, battery-powered "pucks" that combine an accelerometer, a temperature sensor, a processor, and a radio into a single, compact unit.
Leading manufacturers in this space, such as IFM, Advantech, and specialized PdM solution providers like Augury, have engineered these sensors to be deployed directly onto machines, where they remain for years. They eliminate the need for manual routes, cables, and data collectors, fundamentally changing the nature of data acquisition.
This enables a strategy of continuous monitoring. But what does "continuous" actually mean?
It doesn't mean the sensor is streaming terabytes of data every second. That would be impractical for battery life and network bandwidth. Instead, it means the sensor is programmed to take a high-resolution data sample at strategic, regular intervals.
Here’s how it works:
- Configuration: A sensor on a critical, high-speed motor might be configured to take a full, detailed vibration sample every hour. A less critical, stable asset might be sampled every 4-6 hours.
- The Snapshot: At the scheduled time, the sensor "wakes up" and records a high-fidelity snapshot of the machine's vibration—for example, it might sample at a rate of 25.6 kHz for a few seconds. This high sampling rate is crucial for capturing the high-frequency data needed to detect bearing and gear faults.
- Onboard Processing: The sensor's internal processor often performs a preliminary analysis, calculating overall vibration levels (RMS velocity) and key health indicators.
- Wireless Transmission: The sensor then transmits this compact packet of processed data and the raw waveform wirelessly to a central gateway, which securely sends it to a cloud platform for storage and advanced analysis.
This approach provides the best of both worlds: you get frequent, high-quality data snapshots that can catch developing problems early, without the logistical nightmare of manual collection or the technical overhead of constant data streaming. It transforms your monitoring from a periodic health check-up into a 24/7 EKG for your entire facility.
Part 3: The Old Language - Decoding the Signals with Traditional Analysis
Once the data is collected, an analyst must interpret it. For decades, this has been done using two primary tools. Understanding these is essential to appreciating the revolution that AI brings.
1. The Time Waveform (TWF)
This is the most basic view of the data. It's a simple graph plotting the vibration amplitude (how strong the vibration is) against time. Imagine it as a raw audio recording.
- What it's good for: The TWF is excellent for observing impacting events. A sharp, repeating spike in the time waveform might indicate a broken gear tooth that "clicks" every time it comes around. It can also show "clipping," where the signal is so strong it overloads the sensor, indicating a very severe problem.
- Its limitation: A complex machine produces a vibration signal that is a messy jumble of many different frequencies all happening at once. Looking at a complex TWF is like listening to an entire orchestra and trying to pick out just the third violin. It’s nearly impossible to diagnose most faults from the TWF alone.
2. The FFT Spectrum (The Cornerstone of Analysis)
This is where the magic of traditional analysis happens. The Fast Fourier Transform (FFT) is a mathematical algorithm that takes the messy, complex Time Waveform and breaks it down into its individual component frequencies.
The result is an FFT Spectrum, which is a graph that plots amplitude against frequency.
- What it's good for: The FFT Spectrum acts like a prism for vibration. It shows you exactly which frequencies are present in the signal and how strong (how high the amplitude) each one is. Every component in a machine vibrates at a specific, predictable frequency related to its speed. The FFT allows an analyst to see these individual frequencies and diagnose problems. For example, a simple imbalance will show up as a high-amplitude peak at exactly 1x the machine's running speed.
- Its limitation: Reading an FFT spectrum is an art form that requires deep knowledge and experience. An analyst needs to know the exact specifications of the machine—the running speed, the number of balls in the bearing, the number of teeth on the gear—to calculate the expected fault frequencies. They must then manually identify these patterns in a graph that might contain dozens of peaks, harmonics, and sidebands, all while trying to ignore background noise.

Part 4: The Rogue's Gallery - Common Faults and Their Vibration Signatures
A skilled vibration analyst is like a detective, looking for the tell-tale signatures of common culprits. Here are some of the most common machine faults and their classic identifiers on an FFT spectrum.
1. Imbalance
- The Problem: Imbalance occurs when the center of mass of a rotating part is not aligned with its center of rotation. This can be caused by a missing balance weight, dirt buildup on a fan blade, or uneven wear. It's like having a heavy spot on a car tire, causing it to wobble.
- The Signature: This is the simplest signature to spot. Imbalance causes a strong, clear peak in the FFT spectrum at exactly 1x the rotating speed of the imbalanced component. The amplitude of this peak is proportional to the severity of the imbalance.

2. Misalignment
- The Problem: Misalignment occurs when the centerlines of two coupled machines, like a motor and a pump, are not perfectly aligned. There are two main types: angular (at an angle to each other) and parallel (parallel but offset). This misalignment puts immense strain on the bearings and coupling.
- The Signature: Misalignment is characterized by a high 1x peak, similar to imbalance, but it is almost always accompanied by a high peak at 2x the running speed. Often, you will see smaller peaks at 3x, 4x, and so on. A high 2x peak is the classic calling card of misalignment.
3. Bearing Defects
- The Problem: Rolling element bearings are the heart of most rotating machines, but they have a finite life. When a microscopic crack or spall develops on the inner race, outer race, or one of the rolling elements, it generates a tiny, distinct "ticking" sound every time the defect is struck.
- The Signature: This is one of the most complex signatures to analyze manually. These high-frequency "ticks" show up in the FFT spectrum not as a single peak, but as a series of specific, non-integer frequencies called Bearing Fault Frequencies (e.g., BPFO, BPFI, BSF, FTF). A trained analyst must calculate these precise frequencies based on the bearing's geometry and then hunt for them in the spectrum. The presence of these frequencies, often with surrounding sidebands, is a definitive sign of bearing wear.

4. Mechanical Looseness
- The Problem: This refers to excessive clearance in a machine, such as loose mounting bolts, a cracked frame, or worn-out bearings that allow the shaft to move around too much.
- The Signature: Looseness creates a "clunky," non-linear vibration. On an FFT spectrum, it typically appears as a series of harmonics of the running speed (1x, 2x, 3x, 4x, 5x, etc.), often looking like a series of descending peaks. A high level of harmonics across the spectrum is a strong indicator of either looseness or severe misalignment.
Part 5: The Expert Bottleneck - The Limits of the Traditional Approach
The traditional method of vibration analysis, even with better data, is incredibly powerful, but it still has one fundamental, critical limitation: it depends entirely on the availability of a human expert.
This "expert bottleneck" creates several major challenges for industrial facilities:
- Scarcity and Cost: Truly proficient vibration analysts (like those with a Category III or IV certification) are rare and expensive. Most facilities cannot afford to have one on staff full-time and must rely on costly outside consultants.
- Time-Consuming: Even with data flowing wirelessly, a human analyst can only review a limited number of machines per day. They must still manually analyze each spectrum one by one.
- Subjectivity and Risk of Misinterpretation: Reading a complex spectrum is not always black and white. It requires judgment. A missed pattern or a misinterpretation can lead to a missed failure.
- Data Overload: The move to wireless sensors creates a tsunami of data. A facility with 500 sensors collecting data every hour generates 12,000 data points a day. This volume is impossible for a human team to manage effectively. Thousands of data points are collected, but only a fraction are ever properly analyzed.
Part 6: The AI Revolution - A Universal Translator for Your Machines
This is where the entire paradigm of vibration analysis shifts. Artificial Intelligence (AI) and Machine Learning (ML) are not just improving the old process; they are creating a new one. An AI-powered platform acts as a tireless, expert analyst for every single asset, 24/7, turning that tsunami of data into a stream of clear, actionable intelligence.
Here’s how AI overcomes the limitations of the traditional approach:
1. Automated Pattern Recognition
An AI platform can analyze thousands of FFT spectra in the time it takes a human to analyze one. It is trained on vast datasets containing millions of examples of both healthy and faulty machine signatures. It can instantly recognize the tell-tale patterns of imbalance, misalignment, bearing faults, and dozens of other failure modes without any human intervention.
2. Correlative, Contextual Analysis
A traditional analyst is often limited to looking only at the vibration data. An AI platform, however, can correlate the vibration data with other data streams from the machine. It can see how the vibration signature changes with the machine's speed, load, temperature, or even the product being run. This context is crucial. A high vibration level might be normal when a machine is under full load but a severe warning sign when it's idling. AI understands this context automatically.
3. From Complex Data to Clear Diagnosis
- The Old Way: An analyst gives the maintenance manager a report full of complex graphs and says, "I'm seeing elevated sidebands around the ball pass frequency of the outer race on the non-drive end motor bearing."
- The New Way (Factory AI): The AI platform sends an alert in plain English: "Developing Stage 2 Bearing Wear Detected on Motor #3. The fault is located in the outer race. Recommended action: Schedule replacement within the next 6-8 weeks. Probability of failure in the next 30 days: Low."
This is the most critical transformation. AI doesn't just present data; it delivers a clear, actionable diagnosis.
4. Democratization of Reliability
AI puts the power of an expert vibration analyst into the hands of your entire team. The maintenance planner, the reliability engineer, and even the skilled technician can look at a dashboard and understand the health of their assets in simple terms. This frees up the human experts to focus on the most complex, strategic problems, rather than spending their days sifting through routine data.
Conclusion: Speak the Language of Your Factory
Vibration analysis has always been one of the most powerful tools in the reliability arsenal. It has saved countless hours of downtime and prevented innumerable catastrophic failures. But for too long, its full potential has been locked away, accessible only to a select few experts and limited by the infrequency of manual data collection.
The dual revolution in wireless IoT sensors and artificial intelligence has finally provided the key. Modern sensors make it possible to listen to every critical asset in your facility, 24/7. AI-powered platforms provide the universal translator that can interpret that constant stream of data, turning the complex language of your machinery into simple, clear, and actionable English.
By embracing this technology, you are not just adopting a new tool; you are adopting a new philosophy. You are moving from a world of reactive repairs and specialist-driven analysis to a world of proactive, predictive, and democratized reliability. You are empowering your team to stop failures before they happen, transforming your maintenance program from a cost center into a strategic, competitive advantage. The conversation is happening right now on your factory floor. It's time for everyone to listen.

Tim Cheung
Tim Cheung is the CTO and Co-Founder of Factory AI, a startup dedicated to helping manufacturers leverage the power of predictive maintenance. With a passion for customer success and a deep understanding of the industrial sector, Tim is focused on delivering transparent and high-integrity solutions that drive real business outcomes. He is a strong advocate for continuous improvement and believes in the power of data-driven decision-making to optimize operations and prevent costly downtime.