The Ultimate Guide to Pressure Sensors: Your 2025 Playbook for Predictive Maintenance & Uptime
Jul 16, 2025
pressure sensor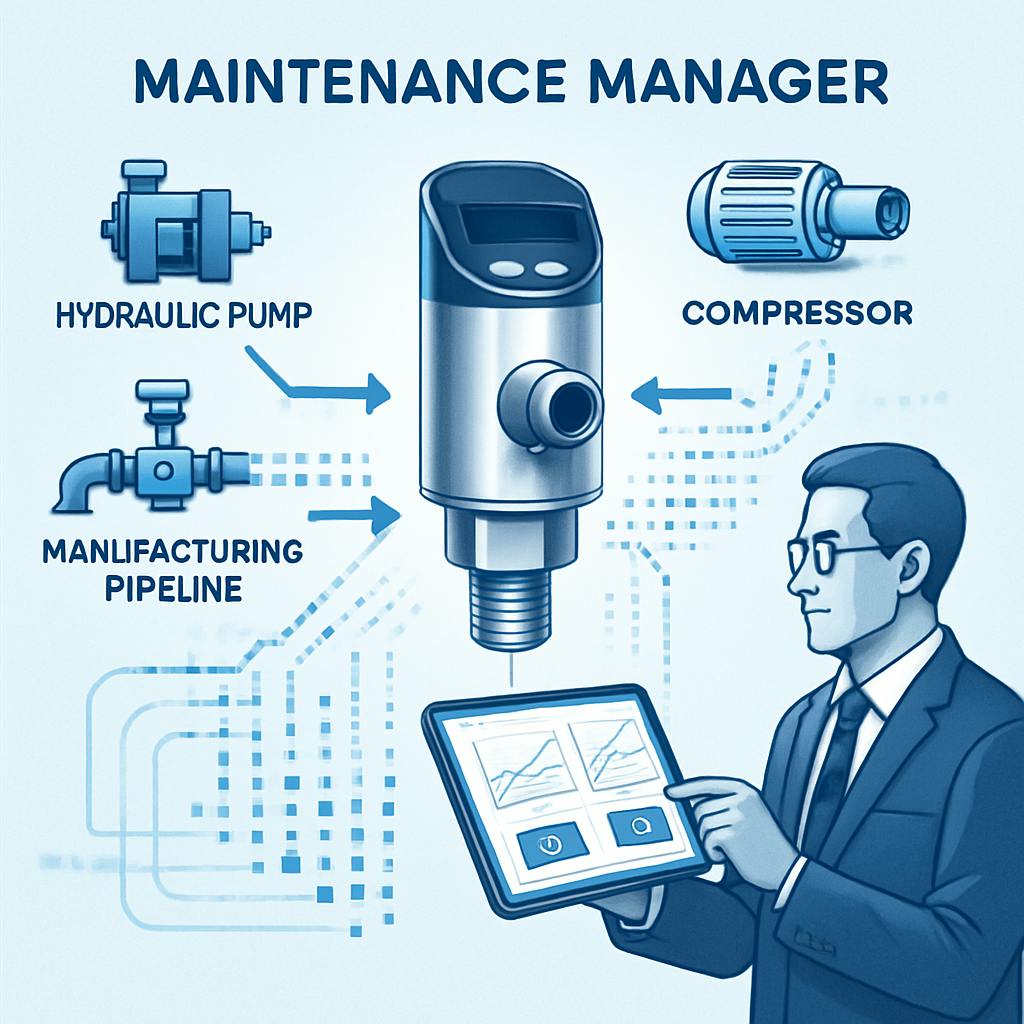
A catastrophic pump failure on Line 3. A mysterious pressure loss that brings your entire pneumatic network to a halt. An unexpected hydraulic hose burst that shuts down your most critical asset for hours. For a maintenance manager or facility operator, these aren't just technical problems; they are high-stress, budget-draining events that can define a quarter. For decades, the response has been reactive. But what if you could see these failures coming days, or even weeks, in advance?
The key isn't a crystal ball. It's a device you've seen a thousand times but may have underestimated: the humble pressure sensor.
In 2025, the pressure sensor is no longer a simple gauge for an operator to glance at. It has evolved into a strategic linchpin of modern industrial maintenance. When integrated with the Industrial Internet of Things (IIoT) and intelligent software, it becomes a source of rich, predictive data that can transform your entire maintenance philosophy.
This is not another technical manual. This is the manager's playbook. We'll move beyond the basic definitions and provide a strategic framework for leveraging pressure sensor technology to slash downtime, boost efficiency, and shift your team from a reactive "firefighting" mode to a proactive state of operational excellence.
Beyond the Basics: What Every Maintenance Manager Needs to Know About Pressure Sensors in 2025
To build a powerful strategy, you need a solid foundation. While your engineers may know the intricate physics, a manager needs to grasp the practical distinctions and applications that impact purchasing, integration, and data analysis. Let's de-jargon the essentials.
De-jargoning the Tech: Pressure Transducer vs. Transmitter vs. Sensor
These terms are often used interchangeably, leading to confusion during procurement and system design. Understanding the difference is key to specifying the right component for your network.
- Pressure Sensor: This is the core sensing element itself. It's the component that physically reacts to the force exerted by a fluid or gas. It detects the pressure change but does nothing else.
- Pressure Transducer: This is a sensor plus signal conditioning circuitry. It takes the raw, often non-linear, and low-level physical change detected by the sensor and converts it into a usable, conditioned electrical output, such as millivolts (mV) or a variable voltage (e.g., 0-5 VDC). Think of it as a translator, turning a physical phenomenon into a basic electrical language.
- Pressure Transmitter: This is the most "intelligent" of the three. It's a transducer that includes additional electronics to amplify and standardize the signal for long-distance transmission, typically to a PLC, DCS, or SCADA system. The most common output is a 4-20 mA current loop. This standard is robust against electrical noise over long cable runs, a critical feature in industrial environments. Many modern transmitters also support digital communication protocols like HART, Foundation Fieldbus, or Profibus, allowing them to transmit not just the primary pressure value but also diagnostic information, calibration data, and device status.
Manager's Takeaway: For modern predictive maintenance programs, you'll almost always be dealing with pressure transmitters (especially "smart" or IIoT-enabled ones) because you need a clean, reliable signal that can be fed into your central data system or CMMS software.
The Core Technologies: A Practical Guide to Sensor Types
The technology inside the sensor determines its accuracy, durability, and cost. Choosing the right one is about matching the tech to the task.
-
Piezoresistive (Strain Gauge): This is the undisputed workhorse of the industrial world.
- How it Works: A silicon diaphragm has a piezoresistive strain gauge diffused or implanted into it. When pressure flexes the diaphragm, it creates mechanical strain, which changes the electrical resistance of the gauge. This change in resistance is directly proportional to the pressure.
- Best For: General-purpose applications in hydraulics, pneumatics, water/wastewater, and process control. They offer a fantastic balance of performance, reliability, and cost.
- Pros: Mature technology, highly reliable, excellent response to both static and dynamic pressures, cost-effective.
- Cons: Can be sensitive to temperature changes (though most modern sensors have built-in compensation), susceptible to damage from extreme pressure spikes.
-
Capacitive: This is the precision player, ideal for low-pressure environments.
- How it Works: The sensor's diaphragm acts as one plate of a capacitor. A fixed plate is positioned close by. As pressure flexes the diaphragm, the distance (gap) between the two plates changes. This change in distance alters the capacitance, which is measured by the sensor's electronics.
- Best For: Low-pressure applications requiring high accuracy and stability, such as HVAC systems for monitoring duct static pressure, cleanroom pressurization, and level sensing in tanks.
- Pros: Extremely accurate and stable at low pressures, excellent long-term stability with minimal drift, relatively insensitive to temperature changes.
- Cons: More complex and generally more expensive than piezoresistive types, can be more sensitive to vibration.
-
Thin-Film & Bonded Foil (Types of Strain Gauge): These are the heavy-lifters, built for toughness.
- How it Works: Similar in principle to piezoresistive sensors, but instead of a silicon gauge, they use a metallic foil strain gauge bonded to a robust metal diaphragm (bonded foil) or a gauge material sputtered directly onto the diaphragm (thin-film).
- Best For: High-pressure applications (e.g., >10,000 psi), environments with high shock and vibration, such as off-road heavy equipment, injection molding machines, and high-pressure test stands.
- Pros: Extremely robust and durable, excellent long-term stability, can handle very high pressure ranges.
- Cons: Typically more expensive and less sensitive than silicon-based sensors, making them less ideal for low-pressure applications.
The Three Pressure Languages: Absolute, Gauge, and Differential
The type of pressure reference a sensor uses is one of the most critical selection criteria. Choosing the wrong one will give you meaningless data.
-
Absolute Pressure: Measured relative to a perfect vacuum (0 PSIa). The sensing element is housed in a sealed chamber with a vacuum reference. Its reading is unaffected by changes in atmospheric pressure.
- When to Use It: When you need to measure pressure independent of the weather or altitude.
- Maintenance Example: Monitoring the vacuum level in a food packaging machine to ensure package integrity. Monitoring condenser backpressure in a steam turbine for efficiency calculations.
-
Gauge Pressure: Measured relative to the current local atmospheric pressure. This is the most common type of pressure measurement. A reading of 0 PSIg means the pressure is the same as the surrounding air.
- When to Use It: For the vast majority of industrial applications.
- Maintenance Example: Checking tire pressure, monitoring hydraulic system pressure (e.g., 3000 PSIg), or measuring the discharge pressure of a water pump.
-
Differential Pressure (DP): Measures the difference in pressure between two separate points. The sensor has two pressure ports (a high side and a low side) and outputs a single value representing the difference (P1 - P2).
- When to Use It: This is a maintenance manager's secret weapon for diagnostics.
- Maintenance Examples:
- Filter Monitoring: Placed before and after a filter. As the filter clogs, the pressure drop across it increases. A rising DP reading is a direct indicator that the filter needs changing. This enables condition-based filter changes instead of time-based, saving money on consumables.
- Flow Measurement: Used with an orifice plate, venturi, or pitot tube. The pressure drop across the restriction is proportional to the square of the flow rate.
- Level Sensing: In a sealed tank, a DP sensor can measure the liquid level by comparing the pressure at the bottom of the tank (liquid head pressure + gas pressure) to the gas pressure at the top.
The Strategic Shift: From Component to Cornerstone of Predictive Maintenance
Understanding the technology is step one. The real transformation comes from changing how you think about pressure data. It's not just a number; it's a narrative about the health of your equipment. By listening to this narrative, you can move from reactive repairs to data-driven, AI predictive maintenance.
Why Pressure Data is a Goldmine for Predictive Insights
In many rotating and fluid power systems, pressure is a leading indicator of failure. It often shows signs of trouble long before a catastrophic temperature spike or a significant change in vibration.
-
Scenario 1: The Failing Centrifugal Pump
- Traditional Method: You wait for a major vibration alert, a loud noise, or a complete loss of flow. By then, the impeller is likely destroyed, and you're facing a major rebuild.
- Predictive Method: A pressure transmitter on the pump's discharge line tells a different story. A slow, steady decline in discharge pressure over several weeks, even when the motor speed is constant, points directly to impeller wear or increasing internal recirculation. A sudden, erratic pressure drop could signal the onset of cavitation, which destroys components. By setting a predictive alert for a 10% pressure deviation from the healthy baseline, you can schedule an inspection and minor repair instead of dealing with a catastrophic failure. This is a core principle of predictive maintenance for pumps.
-
Scenario 2: The Leaky Hydraulic System
- Traditional Method: An operator finds a puddle of oil on the floor, or the machine stops working entirely due to low pressure. This leads to costly fluid replacement, cleanup, and unscheduled downtime.
- Predictive Method: A pressure sensor on the main hydraulic line provides two key insights. First, during operation, unusually rapid pressure fluctuations can indicate a failing accumulator that is no longer damping pressure spikes. Second, during a brief, scheduled shutdown (e.g., overnight), the system can be programmed to hold pressure. A pressure sensor can monitor the rate of decay. A rapid decay indicates a significant leak, while a slow decay points to a smaller, developing leak. This allows you to find and fix leaks before they become major issues.
-
Scenario 3: The Inefficient Air Compressor
- Traditional Method: You pay the ever-increasing electricity bill and replace compressor components when they fail.
- Predictive Method: A network of pressure sensors provides a complete picture of system health.
- A DP sensor across the compressor's air/oil separator indicates when it's time for a change.
- A pressure sensor at the compressor discharge and another at the furthest point of use can quantify the pressure drop across the plant, highlighting the cost of leaks or undersized piping.
- Monitoring the time it takes for the compressor to load and unload (cycle time) against the discharge pressure can predict failing valves or worn piston rings. Optimizing compressors is a huge opportunity, and predictive maintenance for compressors offers a rapid ROI.
The Rise of the IIoT Pressure Sensor: Cutting the Cord on Data Collection
For years, the biggest barrier to widespread pressure monitoring was the cost and complexity of wiring. Running conduit and signal cables from a sensor on a remote pump back to a central control room could cost thousands of dollars per point.
Enter the IIoT pressure sensor. These integrated, often battery-powered devices are a game-changer for maintenance managers.
- Ease of Installation: A wireless pressure sensor can be installed in minutes. You simply screw it into an available port and mount the gateway. This drastically reduces installation costs and allows you to monitor assets that were previously "un-monitorable" due to location or cost.
- Scalability: You can start with a few critical assets and easily expand your network over time without major infrastructure overhauls.
- Accessibility: Place sensors in hard-to-reach or hazardous locations without worrying about complex wiring or worker safety during installation.
- Data Flow: The sensor communicates wirelessly (using protocols like LoRaWAN for long range/low power or Bluetooth for local diagnostics) to a cellular or Ethernet gateway. The gateway then securely sends the data to a cloud platform, where it can be analyzed and visualized.
Integrating Pressure Data into Your CMMS: Creating a Single Source of Truth
Collecting data is useless if it doesn't drive action. The final, critical step is to bridge the gap between the sensor and your maintenance team. This is where the integration between your IIoT platform and your Computerized Maintenance Management System (CMMS) becomes essential.
This integration creates a powerful, automated loop:
- Sense: The pressure sensor detects a deviation from the normal operating baseline.
- Alert: The IIoT platform registers the alert and, based on pre-defined rules, sends a signal via an API.
- Act: The CMMS receives the signal and automatically generates a detailed work order. This work order can be pre-populated with all necessary information: asset ID, problem description (e.g., "Low Discharge Pressure Alert"), relevant PM procedures, required spare parts, and safety checklists. Automated work order software is the engine that turns data into action.
- Resolve: A technician is dispatched, performs the work, and closes the order in the CMMS.
- Learn: The event and its resolution are now logged in the asset's history, enriching the data set for future AI analysis.
This closed-loop system ensures that no alert is ever missed and that your team is always working on the most critical tasks, armed with the right information.
The Manager's Playbook: A Step-by-Step Implementation Guide
Ready to put this into practice? Here’s a step-by-step guide to building a pressure sensor-based predictive maintenance program from the ground up.
Step 1: Asset Criticality Analysis - Where to Start?
You can't—and shouldn't—monitor everything. The key to a successful and cost-effective program is to focus your efforts where they will have the most impact. Conduct an asset criticality analysis.
Create a simple matrix for your facility's key equipment:
| High Impact of Failure (e.g., Production stoppage, safety risk) | Low Impact of Failure (e.g., Redundant unit, minor inconvenience) | |
|---|---|---|
| High Probability of Failure | Monitor First (Priority 1) | Monitor Second (Priority 2) |
| Low Probability of Failure | Monitor Third (Priority 3) | Run to Fail / Time-Based PM (Priority 4) |
Start with the assets in the "Priority 1" quadrant. These are typically your non-redundant, production-critical systems where pressure is a key health indicator: main hydraulic power units, primary process pumps, plant air compressors, and critical chillers.
Step 2: Selecting the Right Pressure Sensor for the Job
Once you've identified your target assets, use this checklist to select the perfect sensor. Getting this right prevents costly rework and ensures you get clean, reliable data.
- Pressure Range & Type: What is the normal operating pressure and the maximum possible pressure (including spikes)? Select a range where your normal operating pressure falls somewhere in the middle 25-75% of the sensor's range for best accuracy. Choose the correct type: gauge, absolute, or differential.
- Accuracy: Don't pay for precision you don't need. A 1% accuracy sensor is fine for general hydraulic monitoring, but you might need 0.1% or better for a lab application or quality-critical process.
- Media Compatibility: What fluid or gas will the sensor touch? The wetted parts (diaphragm and port) must be compatible. 316L Stainless Steel is a common choice, but harsh chemicals may require Hastelloy or other exotic materials.
- Operating Environment: Consider the ambient temperature, vibration levels, and whether the area is classified as hazardous (requiring ATEX or IECEx ratings).
- Output Signal & Connectivity: Are you connecting to a 30-year-old PLC that needs a 4-20mA signal? Or are you building a modern IIoT network that requires wireless connectivity? Ensure your sensor's output matches your data acquisition system. Strong integrations capabilities in your software platform are crucial here.
- Ingress Protection (IP) Rating: How exposed will the sensor be to dust or water? An IP65 rating is suitable for dust-tight and protection against water jets. An IP67/68 rating is needed for applications involving temporary or permanent submersion.
- Process Connection: Ensure the sensor's threaded fitting (e.g., 1/4" NPT, G 1/2") matches the port on your equipment.
Step 3: Installation Best Practices to Ensure Data Integrity
A perfect sensor installed improperly will yield garbage data. Follow these best practices:
- Strategic Location: Install the sensor where the pressure reading is most meaningful. For a pump, this is typically on the discharge line. For filter monitoring, it's one port immediately before and one immediately after the filter housing.
- Minimize Vibration: Avoid mounting the sensor directly to a high-vibration source if possible. If unavoidable, use a short length of flexible tubing to isolate it.
- Manage Pulsation: In systems with fast-acting valves or reciprocating pumps, pressure spikes (pulsations) can damage a sensor. Install a pulsation dampener or a pressure snubber just before the sensor to smooth out these spikes.
- Proper Orientation: For liquid applications, mount the sensor so that air bubbles can escape and not get trapped in the port. For steam applications, use a pigtail siphon to create a water seal that protects the sensor diaphragm from high temperatures.
- Calibration is Not Optional: Every sensor should be calibrated upon installation to verify its accuracy against a known, traceable standard. This process should be documented. Authoritative bodies like NIST provide the foundation for calibration standards in the US. A regular calibration schedule should be created and managed within your CMMS.
Step 4: Setting Baselines and Thresholds with AI
Once data is flowing, you need to define what's normal and what's not.
- Establish the Baseline: Run the equipment under various normal operating conditions (e.g., different speeds, loads, recipes) to capture a comprehensive "health profile." This is your baseline.
- Static Thresholds (The Old Way): Set simple high/low alarm limits. For example, "Alert if pump discharge pressure drops below 85 PSI." This is better than nothing, but it's prone to false alarms and can miss subtle, developing issues.
- Dynamic, AI-Driven Thresholds (The 2025 Way): This is the heart of true predictive maintenance. An AI/ML model learns the complex relationships between pressure, motor speed, temperature, and other variables. It creates a dynamic operating envelope that represents normal behavior under any condition. The system then alerts you to deviations from this learned model. A 5% pressure drop might be normal when the machine is ramping up, but a critical anomaly when it's supposed to be at a steady state. AI can tell the difference; a static alarm cannot.
Real-World Scenarios: Pressure Sensors in Action
Let's see how this playbook translates into tangible results with a few mini-case studies.
Case Study 1: Preventing Catastrophic Failure in a Hydraulic Press
- The Problem: A metal stamping facility was plagued by unscheduled downtime on its main 500-ton hydraulic press. Blown hoses and pump failures were common, causing hours of lost production and significant safety hazards from high-pressure oil spills.
- The Solution: They installed wireless pressure transmitters on the main hydraulic power unit and integrated the data stream with their CMMS.
- The Insight: The AI-powered analytics platform detected a pattern of increasingly erratic pressure fluctuations that were too fast for a human to notice on a gauge. This "noisy" pressure signature is a classic symptom of accumulator bladder failure. The system automatically generated a high-priority work order to inspect the accumulator.
- The Outcome: Technicians found the accumulator bladder was ruptured. They replaced the $500 part during a short, planned maintenance window. This prevented a likely pump failure (a $15,000 repair) and avoided an estimated 8 hours of lost production, saving the company over $50,000 in downtime and repair costs.
Case Study 2: Slashing Energy Costs with Compressor Monitoring
- The Problem: A large manufacturing plant's electricity bill was spiraling out of control. The plant manager suspected the aging compressed air system, often called the "fourth utility," was the culprit.
- The Solution: They deployed a network of wireless pressure sensors. A DP sensor was placed across the main air dryer and filters, and gauge pressure sensors were installed at the end of each main production line.
- The Insight: The data was revealing. The DP sensor showed the dryer's desiccant was saturated, causing a massive pressure drop and making the compressors work harder. The gauge sensors revealed a 25 PSI drop between the compressor room and the points of use—a clear sign of a massive leak network. As noted by experts at ReliabilityWeb, leaks are a major source of wasted energy in industrial plants.
- The Outcome: Using the data to pinpoint problem areas, the team initiated a targeted leak detection and repair program. They also switched from time-based to condition-based servicing of the dryer and filters. The result was a 22% reduction in energy consumption related to compressed air, saving the plant over $80,000 annually.
Case Study 3: Ensuring Product Quality in a Food & Beverage Plant
- The Problem: A bottling plant was struggling with inconsistent fill levels, leading to product giveaway (over-filling) and compliance risks (under-filling).
- The Solution: A high-precision, sanitary-grade capacitive pressure transmitter was installed on the filler bowl to monitor the product head pressure, which must remain extremely stable for accurate fills.
- The Insight: The sensor data, streamed in real-time, showed minute but persistent oscillations in the head pressure that correlated directly with the inconsistent fills. The maintenance team traced the issue back to a worn diaphragm in a pneumatic pressure regulator that supplied the bowl.
- The Outcome: The faulty regulator was replaced. The head pressure stabilized immediately, and fill-level consistency improved by over 90%. This significantly reduced product waste and ensured every bottle met regulatory weight requirements, protecting the brand's reputation.
Troubleshooting Common Pressure Sensor Issues: A Field Guide
Even the best sensors can have issues. Here’s a quick guide for your team.
Symptom: No Output or Zero Reading
- Possible Causes: Incorrect wiring; no power to the sensor; blocked pressure port (e.g., solidified material, debris); complete sensor failure.
- Troubleshooting Steps:
- Use a multimeter to verify the correct supply voltage at the sensor's terminals.
- Double-check the wiring against the manufacturer's diagram.
- Carefully remove the sensor and inspect the port for any blockages.
- If all else fails, substitute with a known good sensor.
Symptom: Erratic or Unstable Readings
- Possible Causes: Electrical noise from nearby VFDs or motors; mechanical vibration; air or gas bubbles trapped in liquid lines; pressure pulsations from pumps/valves.
- Troubleshooting Steps:
- Ensure the sensor cable is shielded and the shield is properly grounded at one end.
- Try relocating the sensor to a less vibration-prone area or use a flexible hose for isolation.
- Bleed the pressure lines to remove any trapped air.
- Install a pulsation dampener or snubber if the source is a pump or valve.
Symptom: Inaccurate Readings (Drift)
- Possible Causes: The sensor has drifted out of calibration over time; a past over-pressure event has permanently deformed the diaphragm; the sensor is being used outside its compensated temperature range.
- Troubleshooting Steps:
- Perform a three-point calibration check (at 0%, 50%, and 100% of the range) against a calibrated pressure reference.
- Review the asset's history in the CMMS for any documented over-pressure events. The sensor may need to be replaced.
- Verify the process temperature is within the sensor's specified operating range.
Your Strongest Asset for a Proactive Future
The pressure sensor has completed its evolution from a simple dial on a machine to a critical data source for your entire maintenance ecosystem. By understanding the technology, focusing on critical assets, and integrating the data stream directly into your maintenance workflows, you can unlock unprecedented levels of insight and control.
The question is no longer "What is the pressure?" but rather "What is the pressure telling me about the future health of my equipment?"
By adopting this playbook, you're not just installing sensors; you're embedding a proactive, data-driven strategy into the DNA of your operations. You're empowering your team to stop fighting fires and start preventing them, turning maintenance from a cost center into a powerful driver of reliability and profitability.
Ready to turn pressure data into your most powerful maintenance asset? Explore how an integrated CMMS software can connect your sensors, automate your workflows, and unlock the full power of predictive maintenance.
